A cute video on business model innovation from the University of St.Gallen (HSG):
Monday, December 16, 2013
Saturday, November 30, 2013
Setting up the Volumes in a NAS
In the case of a local disk, there are typically two file system layers: the partitions and for each partition the directory. A NAS is a storage system and as such has many more layers. Unfortunately the terminology is completely different. For example, we do not talk about disks but about volumes. Instead of abstraction layers, we talk about virtualization. Instead of drives, in the case of NAS we talk of bays.
Let us consider a storage system with two bays and and some system flash memory. We will focus on the Synology system with the DSM operating system (built on top of Debian). The flash memory holds the operating system and the system configuration. This memory is not visible to the user or administrator. When the system is first powered up, the Synology Assistant downloaded from the web (also on the CD-ROM, but not necessarily the latest version) is run and it scans the LAN to find the Synology products. You assign a fixed IP address and install the DSM image you also downloaded from the Synology site.
After the DSM has been installed and booted up, you log into your NAS from a browser and do all the administration from there. The browser has to have Java enabled, because the GUI for DSM is an applet in a browser. You keep the Assistant around because it makes a nice status display with minimal overhead.
The next step is to format the disks and set up the directories. The first time around you do a low-level formatting, because you have to map out the bad sectors. After that, you can do quick formatting, because you just have to build the directories at the various virtualization layers and map the layers. Unfortunately the terminology in the DSM manual is a little confusing. Setting up the storage carriers is called "formatting," although you will do a much more elaborate task. You do not use one of the DSM control panels, but a separate application not shown by default on the desktop and called Storage Manager.
By default, you get a Synology Hybrid RAID, but in the case of a system with two equal disks you do not want that. At the lowest level we have a bunch of blocks on a bunch of disks. Locally, DSM runs the ext4 file system, which sees this as a number of disks with partitions and each partition having an ext4 file system.
In the hybrid configuration, each drive is divided into partitions of 500 GB size. A virtualization layer is then created where all partitions are pooled and the partitions are regrouped as follows. In the case of RAID1, one partition is made the primary, and another partition on a different drive is made its secondary onto which the primary is mirrored. This process continues until all partitions are allocated, then a new virtualization is performed where all primaries are concatenated and presented as a single primary volume. Similarly, the secondaries are concatenated in a single secondary volume.
The reason Synology has introduced the hybrid RAID concept is that in practice the customers of its very inexpensive products fill them up with whatever unused disks they have laying around. In a conventional RAID, the size of the NAS would be that of the smallest disk, with the remaining sectors of the larger disks remaining wasted. If you have a server with 4 or 5 bays, with hybrid you can use all or almost all sectors available.
With 4 TB HDD available in the red flavor for about $200, a 2-bay NAS should do it in the typical SOHO application. At that price, you want to get two equal-size drives. By the way, with only 2 drives, even with hybrid you can only use the sectors available in the smallest drive, because you have only one other drive to put the secondary volumes for mirroring. Finally, you get a RAID because disks fail, so you want to buy a third spare disk for when the first disk breaks. Since statistically the disks from a manufacturing batch tend to have the same life expectancy, you want to buy the spare disk at a slightly later time.
In the case of RAID0, all odd blocks will be the first disk and the even blocks will be on the second disk. This is called striping and it is useful for example if two users stream the same movie but start at a different time. with striping you have less contention for the head and the NAS will run faster. However, you do not have a mirror copy, so when a the first disk fails, you lose your whole NAS.
Therefore, you want RAID1, where each sector has a mirror on the secondary drive. When the first disk fails, you just replace it with the spare drive and keep going. You want to buy right away a new spare disk, because statistically the second drive will fail shortly thereafter. By the way, in the above scenario, depending on the operating system your I/O rate can actually be faster than with RAID0, because the OS will serve the data for the first user from the primary and that for the second user from the secondary, so there will be no latency due to head positioning. In a well designed system the bottleneck will be in the processor and the network.
In the case of a 2-bay RAID, you want to create a RAID1 with 3 volumes. The reason for 3 volumes is that you want to have a separate volume to present outside your firewall; in my case, I allocated 100 GB. The second volume is for backup, because typically backups behave like a gas: they fill the available volume. Modern backup programs fill an entire volume, and when it is full will start deleting the oldest versions of files. This leaves you with no space for your actual data.
The typical IT approach to backups behaving like a gas it to allocate quotas to each user. However, allocating a separate backup user with a limited quota will cause the backup program keeping nagging with a ``quota exhausted'' message. By creating a separate backup volume, the backup software will quietly manage the available space.
The third volume is the one with your actual data and you allocate the remaining sectors to it. Because the second and third volume contain all your private data, you definitively want to encrypt them, so a thief cannot easily get to it. The best encryption is disk encryption. If that is not available, make sure your NAS server has encryption hardware, otherwise it can be slow.
On a NAS with multiple volumes, the volumes are called a disk group. Therefore, in the Storage Manager wizard, you select the mode "custom" and then the action "multiple volume on RAID." Selecting "create disks" will ask you to specify the disks for the group, and of course you select all disks. For "RAID type" you select "1" and the first time around you want to select to perform a disk check, which means low level formatting.
I already gave numbers for the capacity allocation for each disk group. After formatting the first disk group yielding the first volume, you run the wizard again and get volumes 2 and 3. Unfortunately you cannot rename them, so you have to remember their purpose.
At this point, the NAS has two disk drives with an ext4 file system, which at the higher virtualization level does not yet give you any storage, because you do not yet have file systems at the higher level. You can quit the storage manager and continue with the DSM. In local storage parlance, the next step is to install a file system on each partition, which in the local case is done automatically after a disk has been formatted and partitioned. In the case of remote storage, this is achieved by creating a shared folder on each volume. On your local system this folder shows up as the mounted disk; you want to choose the name carefully, so you know what that disk icon on your desktop is.
You will probably use your NAS by mounting it on your computers. The embedded operating system on the NAS will implement various network filing protocols and translate their file operations through the various virtualization layers to ext4 operations. On your client workstation, the operating system will make your mounted remote file system look like and behave like an external disk.
For security reasons you will want to active as few protocols as possible. If you have Unix or Linux clients, you have to activate NFS. If you have Windows PCs, the protocol to activate is SMB a.k.a. CIFS. If you have a Mac, you may want to activate AFP, which will allow you to use Time Machine for backups.
Other than Time Machine, when you mount a remote system on Mac OS system without specifying a protocol, Mac OS will first try to use SMB-2, because it is the highest performance protocol. On a Mac, at first sight it would make no big difference which protocol you are using. However, the semantics for ACL is very different between -nix operating system and Windows, so which protocol you use matters and SMB appears to be the way of the future.
Other notable protocols are HTTP, HTTPS, WebDAV and FTP. The first two you would enable through an Apache Tomcat server. WebDAV and its relatives like CalDAV, etc. are only necessary if you need to edit directly data on the NAS. You want to avoid activating and using FTP, because it sends the password in clear text: use SSH instead.
Friday, October 18, 2013
colored blocks in Beamer
Update: see here for better ways.
The beauty of LaTeX is that you get the best possible typography while focusing on the content, without having to spend any cycles on the looks. For example, when you prepare a presentation, you just pick a theme and do your slides. If you do not like how they look, you change the theme. Consequently, the Beamer class manual just teaches you how to create the flow (overlays, etc.) of a presentation.
In the second part the Beamer manual gives in detail all the information on how to create a new template, but this is too much when you just need a small feature like colored blocks. This is something that usually does not occur in technical presentations, where there already is a specialized block machinery for theorems, examples, etc.
When you do presentations more related to technical marketing, you may want to use colored blocks, for example to clearly discriminate between pros and cons by using green respectively red boxes. Since it is not in the manual, here is how you do colored boxes. Essentially, you declare new block environments in the document preamble:
\newenvironment<>{problock}[1]{
\begin{actionenv}#2
\def\insertblocktitle{#1}
\par
\mode<presentation>{
\setbeamercolor{block title}{fg=white,bg=green!50!black}
\setbeamercolor{block body}{fg=black,bg=green!10}
\setbeamercolor{itemize item}{fg=red!20!black}
\setbeamertemplate{itemize item}[triangle]
}
\usebeamertemplate{block begin}}
{\par\usebeamertemplate{block end}\end{actionenv}}
\newenvironment<>{conblock}[1]{
\begin{actionenv}#2
\def\insertblocktitle{#1}
\par
\mode<presentation>{
\setbeamercolor{block title}{fg=white,bg=red!50!black}
\setbeamercolor{block body}{fg=black,bg=red!10}
\setbeamercolor{itemize item}{fg=green!20!black}
\setbeamertemplate{itemize item}[triangle]
}
\usebeamertemplate{block begin}}
{\par\usebeamertemplate{block end}\end{actionenv}}
The notation for banged color shades is as follows: 10% red is specified as red!10, while green!20!black means 20% green with 80% black.
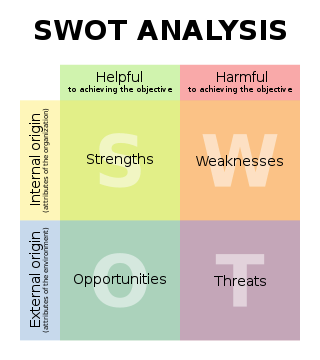
In the document part, a SWOT matrix slide would then be specified as follows:
\begin{frame}{SWOT Matrix}
\begin{columns}[t]
\begin{column}{.5\textwidth}
\begin{problock}{\textsc{strengths}}
\begin{itemize}
\item Business
\begin{itemize}
\item revenue: \$10 B
\item market share: 70\%
\end{itemize}
\item Product
\begin{itemize}
\item 32-bit color
\item written in OpenCL
\end{itemize}
\end{itemize}
\end{conblock}
\end{column}
\begin{column}{.5\textwidth}
\begin{conblock}{\textsc{weaknesses}}
\begin{itemize}
\item Business
\begin{itemize}
\item very expensive
\item gold plating issues
\end{itemize}
\item Product
\begin{itemize}
\item requires at least 128 cores
\item no gamut mapping
\end{itemize}
\end{itemize}
\end{problock}
\end{column}
\end{columns}
\begin{columns}[t]
\begin{column}{.5\textwidth}
\begin{problock}{\textsc{opportunities}}
\begin{itemize}
\item Business
\begin{itemize}
\item everybody wants color
\item clouds love rainbows
\end{itemize}
\item Product
\begin{itemize}
\item cameras deliver 14 bits per pixel
\item big data is pervasive
\end{itemize}
\end{itemize}
\end{conblock}
\end{column}
\begin{column}{.5\textwidth}
\begin{conblock}{\textsc{threats}}
\begin{itemize}
\item Business
\begin{itemize}
\item pursue low hanging fruit
\item people do not care about color quality
\end{itemize}
\item Product
\begin{itemize}
\item competitors use CIELAB
\item spectral is a new trend
\end{itemize}
\end{itemize}
\end{problock}
\end{column}
\end{columns}
\end{frame}
Friday, October 11, 2013
now you can go paperless
In 1945 Vannevar Bush proposed the Memex desk to store and hyperlink all our documents. In 1969 Jack Goldman from Xerox approached George Pake to set up PARC with the task of inventing the paperless office of the future. By the late 1980s, with Mark Weiser's System 33 project all pieces were available and integrated to realize the paperless office of the future, including mobile computing under the name of ubiquitous computing or ubicomp.
The problem was that the computer hardware was still to far behind. A Dorado ran only at 1 MIPS and typically had 4 MB of RAM and an 80 MB disk, but its ECL technology sucked up 3 KW of power and the material cost $112K in today's dollars.
By the mid-1990s the hardware had become sufficiently powerful and cheap that people like Gary Starkweather and Bill Hewlett were able to digitize all their documents and live a paperless life, but not people like us.
For the rest of us the year to go completely digital is 2013. The current Xeon E5 chip-set offers up to 12 cores and 40 GB/s PCI express bandwidth to which you can add a terabyte of fast PCI Express flash storage for the operating system, the applications, and your indices. This is sufficient horsepower to manage, index, and transcode all your digital items.
For the digital items I had hinted at using green disks in the my previous post, but then I made a calculation and showed a picture indicating this might not be a good solution after all. Here is the solution.
In System 33 the documents were stored on file servers, which is still done today in commercial applications. But in the SOHO setting this quickly leads to the monstrosity shown in the last post's picture. Where is the sweet spot for storing our digital items?
An external disk is easy and cheap, because it relies on the PC to manage the disk. In the real world of ubicomp we have many different computing devices, so we need the flexibility of a server. The solution is to use a disk with a minimalistic server, a contraption called a NAS, for network attached storage.

Because the various ubicomp devices have different file systems and file protocols, a NAS will have its own system and then provide the various native interfaces. Typically, the NAS operating system is a bare-bones Linux with an ext4 file system. It will support the main file protocols NFS, CIFS, AFP, FTP, SSH, WebDAV, TLS, etc.
Since your digital items are valuable, you do not want to use a single disk, also because with a large amount of data, backups of shared disks no longer make sense (you still need to backup your own devices). The minimal configuration is to use two identical disk drives in RAID-1 configuration. You also want to have a second NAS on a different continent to which you trickle-charge your digital items.
The box in the picture above is a Synology DS212j, which uses a Marvell 6281 ARM core running at 1.2 GHz. The SoC also includes hardware encryption (yes, you should always encrypt all your data) and a floating point unit. The latter is important because many digital items these days are photographs and an FPU is absolutely necessary to create the thumbnails (for video, you want to do any transcoding on your desktop and store the bits so that they can be streamed directly).
The assembly in the picture comprises the NAS box with the mini-server in the enclosed bottom, a large fan, and the two red disks. On the right side (front) are the status lights and on the left side (back) are the Ethernet port, the power port, a USB port to back up the NAS' own software and data on a stick, and a USB port for a printer to share.
The box in the picture has 512 MB of x16 DDR3 DRAM, which is plenty to run a bare-bones Linux, including such things like a MySQL database to manage the NAS data and a web server to administer the system. You want to attach it to a 1 gbps Ethernet using Cat-6 cabling (but Cat-5e is sufficient for a small home like mine).
When being accessed, the NAS will consume 17.6W + 9W = 26.6W, but when there is no network activity, the disks will go in hibernation mode and the power consumption will drop to 5.5W + 0.8W = 6.3W (the first number is the mini-server, the second is for the disks). In other words, a capable SOHO NAS capable of storing and serving all your digital items uses power comparable to a light bulb. You do not need any special electric service to your garage.
As we have seen regarding the disk colors, you absolutely want a pair of red disks, i.e., two Western Digital WD40EFRX or two Seagate ST4000VN000-1H4168.
Thursday, October 3, 2013
disk service time
In the last post we saw how hard disk drives (HDD) are color coded. I hinted on how to choose the color of a HDD, suggesting that for the main disk a solid state drive (SSD) is actually a better choice, but I left things fuzzy. The reason is that there is no single metric, you have to determine what your work day looks like. Fortunately there is one thing that no longer is an issue: capacity.
Wednesday, September 25, 2013
a red disk never comes alone
The disk industry has undergone an incredible consolidation: there are only three companies left. Toshiba is focused on laptop disks, while Seagate and Western Digital manufacture the whole range. In this battle to the last tooth, the color of disks has become an important survival tool.

Thursday, September 19, 2013
maintaining glossaries
It used to be that scientists in the average took seven years to enter in a field and make a contribution, after which they would hit a ceiling. Their institution would then offer them a sabbatical that would allow them to either get to the next level through osmosis and synergy, or change the field.
Tuesday, September 3, 2013
A new class of bipolar cells
 It took 225 undergraduates more than 20,000 hours of work to map the wiring diagram of a 117 µm by 80 µm patch of a mouse retina. They did discover a new class of bipolar cells, however the patch was too small to determine its exact function: a larger patch is necessary. They will try to achieve this through a crowd-sourcing project known as EyeWire.
News article: Making connections in the eye
Thursday, August 29, 2013
Is veal white, pink, or red?
This is the big question of the week in Switzerland, as on the first of September the new law for the humane treatment of calves enters into effect.
When I was in the third school year, our teacher Egidio Bernasconi took us to visit the stable of our classmate Rita Spizzi. Her father was in charge of food at the private clinic Moncucco in Coremmo, just behind our school building. Besides the large vegetable garden, he also had half a dozen cows, and that was the topic of the lesson.
We learned about agribusiness. In the self-sustenance times, a farmer in the Prealps would have one or two cows to provide the proteins for his family. Spizzi's operation was larger, because it had to sustain a clinic instead of just a family.
A cow's main product was its milk, which had a shelf life of only a couple of days. The cream would be skimmed off and cultured for a few days to make butter, which had about a week of shelf life. The excess milk would be used to make yogurt, which had a longer shelf life. When there was a lot of excess milk, it would be used to make cheese, which depending on the type could last for a whole season.
When a cow would no longer produce milk due to her age, Mr. Spizzi would sell her to the slaughterhouse. This explains why the typical beef dish of the region is brasato: the meat had to be stewed for hours in a red wine sauce because it was very tough, coming from old cows.
Mr. Spizzi always needed enough cows to feed the patients and staff. Every spring he would walk his cows to the outskirts of town to visit a bull. Half of the off-spring would be female, and that was good, because Mr. Spizzi could select one to raise to replace the next old cow; the other cows would be raised to be sold at the fair. This is why Mr. Spizzi spend a little more money to use a select bull, as its offspring would fetch a higher price at the market.
For the male offspring there was not much use, because only few bulls are required. Mr. Spizzi would keep them as long as they can live on their mother's milk, then sell them to the slaughterhouse. Because these calves were young and milk-fed, their meat was whitish. By the way, this is why in the Insubrian culture the fancy meat is veal scaloppine.
This was a long time ago and in modern agribusiness a farmer has an order of magnitude more cows. Also, much progress has been made in cattle feed, so the farmer can make more money by feeding his calves for a longer time, yielding more meat.
This is where the animal protection groups come in and the new law for veal comes into play. When the calves are kept alive for a longer time, they would naturally eat hay and grass, roaming on the Alps. Their meat would become reddish. Although taste and nutritional value are the same, for centuries people have known that the whiter the veal, the more it was tender. Before the new law, a farmer would have been paid less per kilo if the veal was redder.
To keep the veal whiter, the contemporary farmer would keep his animals on milk and indoors, but this means that the calves are anemic and therefore tortured.
The current debate is on whether veal should be red, pink, or white. This is where color science comes into play. Instead of using color terms, the experts want to sound more authoritative by using numbers rather than words. Instead of red, pink, white, they use 38, 42, 48. They never mention a unit, so what are these numbers? Is there a new redness scale?
It turns out that the new law also introduces a new standardized method to determine the color of veal. The carcass is measured at a specified location near the shoulder with a Minolta colorimeter. The first number on the colorimeter is the color number for the carcass.
Zooming in on the pictures reveals that the colorimeter is displaying CIELAB data, so the first number is L*. Therefore, what the gastronome takes for red, pink, white, a color scientist would take for dark, medium, light.
Newspaper article on the debate (in German): Kalbfleisch-Knatsch in der Fleischbranche.
Tuesday, August 27, 2013
Generating your publication list
It is often necessary to compile one's bibliography. For example to apply for a grant or a job. One approach is to keep a text file and update it as you publish. However, unstructured data is a pain to update when you fall behind, and you anyway already have your publications in your bibliography database. Is there a quick and simple way to generate a publication list?
For those using BibDesk to manage their bibliography, the answer is Jürgen Spitzmüller's biblatex-publist package. It generates correct citations leaving out your name, sorts them by date, and allows grouping by publication type.
In the preamble you just add three items:
\usepackage[bibstyle=publist]{biblatex}\omitname[your first name]{your last name}\addbibresource{biblio.bib}
In the document part you just add a block like below for each publication type:
\section{Patents}\begin{refsection}[biblio]\nocite{*}\printbibliography[heading=none, filter=mine, type=patent]\end{refsection}
The citation result will look like this when set into type:
Aug. 2006 (with Audrius J. Budrys). “Multi-component iconic representation of file characteristics”. 7,086,011. Hewlett-Packard Development Company.
If you are still using BibTeX, this is a good time to update your engine. BibTeX has been obsolete for many years and is no longer used these days. People now use biblatex, and publist is just a style file for biblatex. Actually, biblatex still uses BibTeX, so you want to switch your engine to Biber.
The make the switch, in the TexShop preferences go in the Engine tab and replace the BibTeX engine bibtex with biber. It may be necessary to run the TeX Live utility to update all the packages, as there has been a bug fix in the last week.
Extra tip: Option-Go to the folder ∼/Library/TeXShop/Engines/Inactive/Latexmk/ where you find the file Latexmk For TeXShop.pdf with the instructions on how to typeset your documents with a single mouse click.
Saturday, August 17, 2013
Energy footprint of the digital economy
Back in 2009 we looked at the carbon footprint of ripping color documents for digital presses and published the result in the EI 2010 paper "Font rendering on a GPU-based raster image processor." Assuming the raster image processor is run at maximum capacity, the state of the art system at the time consumed 38,723 KWh and generated 23,234 Kg of CO2. By using GPUs, we were able to rip the same data with 10,804 KWh respectively 6,483 Kg of CO2. At the time we thought saving 16,751 Kg of CO2 per year per RIP was a pretty cool result, but at the end the product never shipped, despite — or maybe because — it was much lower cost. (See the paper for the details of the calculations.)
This month the Digital Power Group published the white-paper "The cloud begins with coal: big data, big networks, big infrastructure, and big power." The work was sponsored by the National Mining Association and the American Coalition for Clean Coal Electricity, which explains why some of the numbers appear a little optimistic in terms of the coal needed to keep the smart phones running and serving contents, but even if we divide the numbers by 5 to make them a little more realistic, the numbers are quite staggering when we add everything up. It turns out, that a smart phone requires as much coal as a small refrigerator. Cloud computing will consume an ever increasing fraction of our total energy consumption. This is a good reason to work on more efficient and greener storage systems.

Thursday, August 15, 2013
Data Privacy
During the ascent of Nazism in Europe in the decade before world war II, the Swiss banks introduced secret bank accounts to hide the identity of persecuted customers from infiltrated spies working at the banks or loitering in their lobbies. After the war, this mechanism was abused by the banks to assist tax evaders and consequently has been largely dismantled.
Apparently, the Swiss have been able to maintain their reputation as a discreet country. An echo effect of the leak of an American agency's penchant for snooping everybody's data, is that more entities are now storing their data in Switzerland, although data storage in Switzerland is about 25% more expensive than in the neighboring EU countries. "Our customers know that money can be replaced — but sensitive data can not," says Mateo Meier of Artmotion, a data center in Zürich. Switzerland's know-how, political stability and adequate infrastructure are ideal conditions to store data securely, he says.
History does not repeat itself, and the Swiss have learned from the mistakes related to bank secrecy: there are no privacy rights for suspected felons and their data.
Newspaper article: Schweizer Datentresore sind nicht sicher
Sunday, August 11, 2013
Color can prevent shark attack
 A Western Australian company has used pioneering research by leading University of WA shark experts to develop wetsuits designed to confuse sharks or render surfers invisible to the predators. The world-first shark repellent suits are based on discoveries by Associate Professor Nathan Hart and Winthrop Professor Shaun Collin, from UWA's Oceans Institute and School of Animal Biology, about how predatory sharks see and detect prey. The suits use a specific combination of colours and patterns to deter the creatures. One design — known as the ‘cryptic' wetsuit — allows the wearer to effectively blend with background colours in the water, making it difficult for a shark to detect or focus on the wearer. The other design — the ‘warning' wetsuit — makes the user appear highly visible by using disruptive and high contrast banding patterns to make them appear totally unlike any normal prey, or even as an unpalatable or dangerous option. The designs also come in the form of stickers for the undersides of surfboards. While the company Shark Attack Mitigation Systems could not claim the suits were a failsafe protection against shark attacks, results from initial testing of the wetsuits in the ocean with wild sharks had been ‘extraordinary'.
Original article: UWA science leads to world-first anti-shark suits
See also Why are animals colourful? Sex and violence, seeing and signals
Friday, August 9, 2013
Skin-Whitening
In Japanese culture a white skin is an important component of female aesthetics. In the old days, maikos applied a thick white base mask that was made with lead, but after the discovery that it poisoned the skin and caused terrible skin and back problems for the older geisha towards the end of the Meiji Era, it was replaced with rice powder.
At the end of 2007 it appeared that the cosmetics industry had finally invented a skin whitening product that is both safe and convenient, as we reported in this blog in a whiter shade of pale. Unfortunately it now appears this Rhododenol product is unsafe after all.
2,250 users of Kanebo Cosmetics Inc. skin-whitening cosmetics have reported developing serious symptoms such as white blotches on their skin. Serious effects of the products include depigmentation in an area of at least 5 cm and depigmentation in three or more areas of the body, as well as clearly visible depigmentation in parts of the face. In total, the company has received more than 100,000 inquiries in connection with the recall.
The product in question is named "Rhododenol." Kanebo earlier said it has been marketing cosmetics that use the ingredient as an active substance since 2008 via various retail outlets. The company said it has secured the cooperation of the Japanese Dermatological Association in getting a list of medical facilities which will treat the symptoms posted on the association's website. Kanebo Cosmetics Inc.'s voluntary recall of its skin-whitening line is likely to deal a crippling blow not only to its brand image but also to its parent Kao Corp. It will not be easy to restore the image of the damaged brand. The recall became more damaging due to Kanebo's delayed response.
Thursday, August 1, 2013
NIH To Fund Big Data Projects
Biomedical research is increasingly data-intensive, with researchers routinely generating and using large, diverse datasets. Yet the ability to manage, integrate and analyze such data, and to locate and use data generated by others, is often limited due to a lack of tools, accessibility, and training. The National Institutes of Health announced that it will provide up to $24 million per year for the new Big Data to Knowledge (BD2K) Centers of Excellence. This initiative supports research, implementation, and training in data science that will enable biomedical scientists to capitalize on the transformative opportunities that large datasets provide.
Press release: NIH commits $24 million annually for Big Data Centers of Excellence
Web site: NIH Big Data to Knowledge (BD2K)
Wednesday, July 17, 2013
WIPO Adopts Treaty to Grant Copyright Exceptions for Visually Impaired
The Marrakesh Treaty to Facilitate Access to Published Works for Persons who are Blind, Visually Impaired, or otherwise Print Disabled was unanimously adopted by the United Nations' World Intellectual Property Organization (WIPO) at a 17–2 June meeting in Marrakesh, Morocco. The Treaty seeks to improve access to published works for the more than 300 million blind and visually impaired people around the world by creating an exception to internationally-recognized copyright restrictions. The treaty guarantees the right for the visually impaired to reproduce, distribute, and translate works without obtaining a license from the author.
Link to the article in Intellectual Property Watch: Over 50 Countries Sign Marrakesh Treaty On Copyright Exceptions And Limitations For The Blind
Monday, July 15, 2013
Risotto, move over
 We have been using saffron to make risotto and paella yellow for centuries. Saffron, though, is very expensive. Now there is a new patented process to make rice in red, yellow, green, and purple, with the caveat that green does not survive cooking. I wonder if an orange risotto, which in addition to saffron would use ang-khak rice mold, would be less fattening, given the statins in Monascus purpureus.
Here is the article from Focus Taiwan.
A government-assisted farmers' research group in eastern Taiwan has developed "colorful" rice — no longer rice in white, but in four different colors — red, yellow, green and purple. The Hualien District Agricultural Research and Extension Station — which is dedicated to helping local farmers improve their earnings from farming, including by coming up with new products — said it has spent seven years developing the technology to add natural colors to rice using vegetables. "The colorful rice can add interest, enrich your visionary sight and increase your appetite, especially for children," the station said. It said that Southeast Asian countries and India have used natural colors to cook rice since ancient times, mostly using turmeric (a plant of the ginger family) and herbs to give rice color. It said that using the natural colors of vegetables to produce colorful rice is both "safe and delicious." The four colors developed by the station — red, yellow, green and purple — are derived from using anka (red yeast, Monascus purpureus), turmeric, chlorophyll (green pigment derived from green vegetables) and anthocyanidin (plant pigment). The station noted that rice colored with anka, turmeric, and anthocyanidin will not change color during the cooking process. The green color, using chlorophyll, however, tends to turn into an olive color after cooking. "The best ingredient is using something that is natural," the station said. It said that it is not only targeting families as the main consumers of colorful rice, but is also eying hostels or leisure farms, which may want to use it for creative dishes. They could also make it a souvenir or gift for visitors, he said. In the earlier days of research into making colorful rice, the technology could only produce a small amount of colorful rice, according to the station. But after further development, it has come up with the technology for mass production, and has obtained a patent. The station later transferred the technology to the private sector, which can now produce two metric tons of colorful rice each day.
Wednesday, July 10, 2013
Global Innovation Index
For the first time since 2009, the U.S. has been ranked among the top five nations in the Global Innovation Index 2013 (GII). The U.S. placed fifth behind Switzerland, Sweden, the U.K., and the Netherlands, ranked first through fourth, respectively. The annual report, released by the World Intellectual Property Organization, Cornell University, and INSEAD, is a key benchmarking tool for businesses, policy makers, and others concerned with the relative status of nations in the global innovation environment.
The GII relies on two sub-indices, the Innovation Input Sub-Index and the Innovation Output Sub-Index, each built around pillars.
Five input pillars capture elements of the national economy that enable innovative activities: (1) Institutions, (2) Human capital and research, (3) Infrastructure, (4) Market sophistication, and (5) Business sophistication. Two output pillars capture actual evidence of innovation outputs: (6) Knowledge and technology outputs and (7) Creative outputs.
Each pillar is divided into sub-pillars and each sub-pillar is composed of individual indicators (84 in total). Sub-pillar scores are calculated as the weighted average of individual indicators; pillar scores are calculated as the weighted average of sub-pillar scores.
Monday, July 8, 2013
Tokyo Police to Introduce 3D Printers for Prosecutors in Court
The Tokyo Metropolitan Police Department aims to introduce 3D printers for prosecutors to create more graphic crime scenes in court. The agency will use US-made machines capable of making solid color objects made of plaster using 3D image data captured with portable special cameras. The models will recreate murder scenes, or fire scenes details such as wall colors, shape and furniture layout. The department hopes that such models will assist judges to visualize circumstances such as culprit entry and escape routes as well as crowd member positions at the crime scenes. In current criminal proceedings, prosecutors generally describe crimes using pictures, photos and floor plans; although some of them have had 3D models made manually and used them at trial. The department has already started making prototypes based on the data from several cases. The Metropolitan Police's Criminal Investigation Laboratory introduced 3D printers in 2011 and has since applied them to actual investigations.
Source: Nikkei
Thursday, June 20, 2013
3-D printers now mainstream
One way to tell a technology has crossed the chasm from the visionary early adopters to the pragmatic early majority is when it is written up in your local newspaper. Although 3-D printers have been around for many years, they have been an expensive and fragile tool for techies.
In today's New York Times, Amy O'Leary has written an article describing several examples of things people can do for their everyday life, complete with model recommendations and prices, as well as a link to Amazon's new on-line store for digital printing.
Tuesday, June 18, 2013
Robots in your eyes
Retinal vein occlusion from glaucoma is only one of several diseases that can decrease the oxygen supply to the retina: Like every tissue of our body the retina needs oxygen. An insufficient supply can cause blindness, sometimes within mere hours. In order to make a fast and correct diagnosis, physicians need to be able to assess oxygen levels within the eye. However, the currently available tools are not very sensitive. Researchers of the multi-scale robotics lab at ETH Zürich have now developed a micro-robot that can measure the retina’s oxygen supply.
News article with link to the paper: Oxygen-sensing microrobots.
Friday, June 14, 2013
Shape Description Experiment: Comments and Discussion
This is a follow-up post to the Shape Description Experiment to allow reader comments and questions. Thanks.
Shape Description Experiment
If you have comments or questions about this experiment: Please post them here.
Thursday, June 13, 2013
Photography or photographs
Tuesday I attended an interesting seminar organized by Joyce Farrell at The Stanford Center for Image Systems Engineering (SCIEN). The presenter was
David Cardinal, professional photographer, technologist and tech journalist who talked about Photography: The Big Picture — Current innovations in cameras, sensors and optics.
To cut a long story short,
- DSLR systems will be replaced by mirror-less systems, which deliver almost the same image quality for the same cost but are an order of magnitude lighter
- point-and-shoot cameras will disappear, because there is no need to carry around a second gadget if it brings no value added over a smart phone (the user interface still needs some work)
- phone cameras will become even better with plenoptic array sensors etc., like the one by Pelican Imaging
An interesting factoid for those in the storage industry is that according to an IDC report cited by David Cardinal, in 2011, people took a total number of digital photographs requiring 7 ZB of storage (a zettabyte is 270 bytes). All those photographs could not end up on social networks, because even if for example with Flickr you get 1 TB of free storage, with the typical American broadband connection it would take 6 months to upload that terabyte of images.
David Cardinal mused that maybe people are no longer interested in photographs, but rather in photography. By that he means that people are just interested in the act of taking a photograph, not in sharing or viewing the resulting image. Therefore, he speculated the only time an image is viewed might be the preview flashed just after pressing the release button.
Is that so? According to Cisco's forecast, globally, Internet traffic will reach 12 GB per capita in 2017, up from 5 GB per capita in 2012. For photographers, these are not big numbers when one considers that a large portion of the Internet traffic consists of streamed movies and to a minor degree teleconferences (globally, total Internet video traffic (business and consumer, combined) will be 67% of all Internet traffic in 2017, up from 52% in 2012).
However, we might not remain stuck with the current miserable broadband service for long, and receive fiber services like the inhabitants of Seoul, Tokyo, Osaka, etc. do get. In fact, just a kilometer from here, Stanford's housing area is already on Google Fiber, and other places will soon be receiving Google Fiber, like Kansas City and others around it, Austin, and Provo (in Palo Alto we have fiber in the street, but it is dark and there is nothing in the underground pipe from the curb to my network interface). According to Cisco, globally, the average broadband speed will grow 3.5-fold from 2012 to 2017, from 11.3 Mbps to 39 Mbps (reality check: currently our 6 Mbps down and 1 Mbps up, $48/month, VDSL service delivers 5.76 Mbps down and 0.94 Mbps up; 1 km west, our residential neighbors at Stanford get 151.68 Mbps down and 92.79 Mbps up—free beta Google Fiber). In summary, there is reason to be optimistic.
Should Flickr plan to open a 20 ZB storage farm by 2017 in case people will be interested in photographs instead of photography? Probably not. The limit is not the technology but the humans on either end. We cannot enjoy 20 ZB of photographs. Just ask your grand-parents about the torture of having had to endure the slide-shows of their uncle's vacation.
The path to the answer to David Cardinal's question about photography vs. photographs is tortuous and arduous, at least it was for me.
In spring 1996, HP's storage division in Colorado started manufacturing CD-ROM drives for writable media. To create a market, the PC division decided to equip its new consumer PC line with the drives. The question was what could be the killer-app, and they went to HP Labs for help, because Quicken files would never justify an entire CD-ROM.

At that time my assignment was to work on a web site to showcase a new image format called FlashPix (see image above, click on it to see it at full resolution; a GIF version of the demo is still here). The folder Web Album at the bottom center of the desktop contained the demo I gave the CD-ROM people from Colorado.
In February 1991 I had a dinner with Canon's president Dr. Yamaji, where we strategized over the transition from AgX photography to digital. At that time, Canon had the $800 Q-PIC for consumers (really a camcorder for still video images), and a $28,000 professional DSLR. By considering the product release charts of both Canon and its suppliers, we figured that it would be 2001 until digital could replace AgX in both quality and price. For the time in-between we decided to promote Kodak's Photo-CD solution as a hybrid analog-to-digital bridge.
The people at Kodak told us the average American family keeps their images in a shoe box, with the average number of photographs being 10,000. By looking at the evolution curve of disk drives, which at the time was twice as steep than Moore's law for micro-processors, we figured that the digital family would accumulate an order of magnitude more photographs, namely hundreds of thousands, because the effort and cost per photograph would be so much lower in digital.
As in 1996 I was assembling collections of a few thousand photographs for the FlashPix project, it quickly became clear that images on a disk are much more cumbersome to browse and organize than prints in a shoe box. I tried several commercial asset management programs, but they were too slow on my low-end PC.
I ended up implementing a MySQL database and maintain a number of properties for each image, like keywords, rendering intent prediction, sharpening, special effects, complexity, size, copyrights, etc. Unfortunately it turned out it was very tedious to annotate the images, and it was also very difficult.
Indexing entails categorization, which is a difficult cognitive task, requiring a high degree of specialization. What makes this worse is that the categorization changes in time as iconography evolves. Categorization has a scaling problem: a typical consumer album in 1996 required more than 500 keywords, which are hard to manage. Hierarchical keywords are too difficult for untrained people and taxonomies (e.g., decimal classification system) are too bulky. We proposed a metaphor based on heaping the images in baskets on a desktop:

The labels on the baskets were sets of properties we called tickets, represented as icons that could be dragged and dropped on the baskets. The task was now manageable, but nothing that could be used by consumers.
In a family there typically was a so-called photo-chronicler who would go through the shoe box and compile a photo-album. Photographs by themselves are just information: to become valuable they have to tell a story in the form of a photo-album.

The applet on the right side was running in a browser and would interface to the content on the MySQL database running on the public HP-UX server under my desk. The idea was to reduce the work by allowing any family member who would have time to fill in some of the data: we replaced the model of the mother photo-chronicler with a collaborative effort involving the whole family, especially the grand-parents, who typically have more time.
Collaborative annotation introduces a new problem, namely that each individual has their own categorization system. As described in Appendix II of HPL-96-99, there is a mathematical theory that provides a solution to this problem. An A-construct in mathematics is very similar to an ontology in computer science. The solution is to create ontology fragments for each contributor and then map them into each other leveraging the general structure theory.
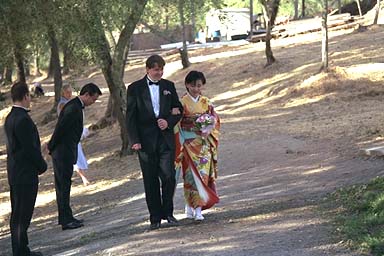
Unexpectedly I received a Grassroots Grant, which allowed me to hire a student to rig up an interface to Stanford's Ontolingua system. As a difficult example we took photographs from a mixed-race and mixed-religion wedding (a small sample of the images is here).
We wrote up a conference paper (a free preprint is available here) in a couple of nights, because that was it. A senior manager had determined that nobody would ever have more than 25 digital photographs. The manager insisted that when people would take new pictures, they would delete old pictures so that only the best 25 photographs survive. That was it and the project was killed.
In a way, David Cardinal's photography would be an extreme form of this assertion, where only the last photograph survives, and that only for an instant.
In my view, people are too fond of their memories to just toss them. The future will not be a pile of 20 ZB in pixels. Value is only where a story can be told, and our job is that of creating the tools making storytelling easy.
In retrospect, my mistake in 1996 was to do the annotation as a separate workflow step to be performed after triage. Today the better approach would be to use voice input to annotate the photographs while they are been taken. Today, the metadata is just the GPS coordinates, the time, and the other EXIF metadata. How about having Siri asking the photographer "I see five people in the image you just took, who are they?" "Is this still a picture of the wedding?" etc. Easier and more accurate than doing face recognition post factum. Last but not least, we have the image processing algorithms to let Siri exclaim "Are sure you want me to upload this photograph, I think it is lousy!"
I am game for uploading my share of 4 GB in photographic stories when 2017 comes around!
Wednesday, June 12, 2013
White House tackles trolls
On June 4 the White House issued a fact sheet that laid out a framework for five recommended executive actions and seven legislative recommendations for both branches of government to address as a means to tackle "patent trolls." For example, the Patent and Trademark Office will draft a proposal to require patent applicants and owners to "regularly update ownership information" as a means of protecting against the creation of shell companies for hiding abusive litigants. Further, it will permit more discretion in awarding fees to prevailing parties in patent cases, providing district courts with more discretion to award attorney’s fees as a sanction for abusive court filings. It also calls on Congress to craft similar legislative language.
Link: Fact Sheet: White House Task Force on High-Tech Patent Issues
Monday, June 10, 2013
The power of crowd sourcing
This morning on the local radio in the transmission Morning Edition there was a short piece on the new NSA data farm in Utah, which is supposed to go on-line this September. The piece stated that the data farm will store 5 zettabytes, and the old data farm in Virginia, which will remain on-line, has about 2/3 of the capacity.
These 8 zettabytes are contributed by us aliens, i.e. non citizens: this makes it crowd sourced data. How does this compare to the data that the best and brightest scientists in the world can create? At CERN, the CERN Data Centre has recorded over 100 petabytes of physics data over the last 20 years; collisions in the Large Hadron Collider (LHC) generated about 75 petabytes of this data in the past three years; the bulk of the data (about 88 petabytes) is archived on tape using the CERN Advanced Storage system (CASTOR) and the rest (13 petabytes) is stored on the EOS disk pool system — a system optimized for fast analysis access by many concurrent users. For the EOS system, the data are stored on over 17,000 disks attached to 800 disk servers; these disk-based systems are replicated automatically after hard-disk failures and a scalable namespace enables fast concurrent access to millions of individual files.
A zettabyte is 270 bytes and a petabyte is a paltry 250 bytes, indicating that crowd sourcing can yield 5 orders of magnitude more data than the best scientists can. And while the scientists use the most powerful particle smasher ever built by human kind, the crowd just uses their fingers on plain old keyboards.
The more mind-boggling data point is that at some point the NSA may want to synchronize the data in the two farms. To get an idea of the required bandwidth, consider that backing up a 1 terabyte (240 bytes) solid state disk to a top-of-the-line external disk over a FireWire 800 connection takes 5:39:39 hours…

Servers at the CERN Data Centre collected 75 petabytes of LHC data in the last three years, bringing the total recorded physics data to over 100 petabytes (Image: CERN)
Friday, June 7, 2013
Why color naming
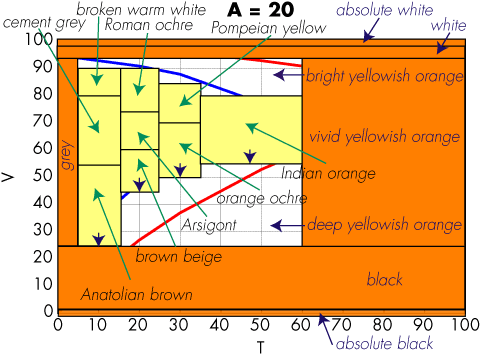
Mid June 1993 I was strolling along the Duna river in Szentendre with Antal Nemcsics and Lucia Ronchi. We stopped, looking across the river, while Nemcsics was explaining his Dynamic Color theory. Then he turned around and with a broad sweep of his arm he referred to the cityscape stating "it has just been all repainted in its original colors; is it not beautiful how all these yellows from the local clays harmonize?" He then started calling out the names for the yellows and explained how the restoration was based on the sequence of the color names.
When I interjected that color names are arbitrary conventions between painters, and sequences in a perceptually uniform color space might be better, he countered that the color names were not arbitrary but based on solid psychophysics. He answered my question on how the 15 students typically recruited for psychophysical experiments could define something so complex as the names of colors, with the bold statement that for many years all his students had to contribute their data and his Coloroid system was based on the outcome of over 80,000 experiments. Wow, big data!
I had to turn around to the Duna river and take a deep breath. That instant in Szentendre remained deeply impressed in my memory, and I visualized the color name regions of varying volume in the Coloroid space.
A decade later, when I was working on the readability problem of colored text on a colored background, I first implemented an algorithm based on distances in CIELAB. While the solution worked from an engineering point of view, it was not entirely satisfying, because a fixed distance in the entire CIELAB space did not reflect the reality of readability for the various color combinations.
Szentendre came to mind and I decided to try out a different implementation based on lexical distances. Implementing the Coloroid system was not a piece of cake, because the calculations are numerically instable and not all the details of the space are published. Also, if the color names in the Coloroid atlas are adequate for urbanistic applications, some extensions are required to achieve a bullet-proof application for automatic document publishing.
I presented the result at the 2005 AIC meeting in Granada, but I must admit that not many people stopped by at my poster, although it resulted in a collaboration with Silvia Zuffi on the CIELAB based implementation.
Since the color naming solution was going into a product, a patent application was filed, but very reluctantly and with much hesitation. Indeed, color naming and color categorization were very controversial.
Suddenly, in the last few days everything has changed. We now know experimentally that at the quantum level time does not really exists as we perceive it. This new twist on entanglement is one of the tenets for Federico Faggin's new proposal for the concept of awareness. In one arm of the entanglement we have Kirsty L. Spalding, who after a decade of very difficult work studying the hippocampus of people exposed to the fallout of nuclear bomb tests was able to prove experimentally the physiological existence of a locus for categorization. In the other arm we have patent 8,456,694, which thanks to this entanglement is made rock solid.
Thursday, June 6, 2013
Proofing a page for color discriminability problems based on color names
Now that there is a physiological basis for color categorization, we can ask ourselves what this is good for. We cannot eat it, but it might have considerable commercial value in United States Patent 8,456,694 issued two days ago on June 4, 2013. I am not a lawyer, but it appears that if you take two colors, determine their names, and then do anything with it, you might have to license this patent (but you can still keep your hippocampus ☺).
In large American corporations, when a new CEO start their new position, they often begin by putting their mark on the company's branding. They remodel their office and maybe even the HQ entrance, tweak the logo, design a new font, change the corporate palette, etc. These endeavors cost millions of dollars, but big corporations can afford it, especially when as a consequence other big corporations get motivated by the new branding to buy more widgets of the new CEO's company.
The only pity is that often this means that entire forests are wasted when the company has to reprint all its marketing collaterals. Around 2000, my employer at the time had a big warehouse in Campbell with product brochures, but fortunately our manager had been able to convince the company to deploy a document management system and print the marketing collaterals on demand, just when they were needed.
The hard problem came when a year later the CEO decided to change the color palette. Although all brochure chunks were stored digitally, when a brochure was produced by combining chunks with the old palette and chunks with the new palette, the resulting brochure looked inconsistent.
Colleagues Hui Chao and Xiaofan Lin quickly wrote code that could perform a wide range of graphical changes to the collaterals in the repository, and this writer wrote a few lines of code that would replace an old palette color with the perceptually nearest color in the new palette. Unfortunately, already the first test run demonstrated that this was a hack that did not work in practice. For example, many chicklets ended up having bright green text on orange background, something chromatically challenged people with color vision deficiencies could not read.
The solution that worked was to use a model to compute the names of the foreground and background colors, then change one of them to the nearest color in the new palette that was at least to color name categories away from the other color. This solution ended up being very good in practice and we wrote very efficient code that could process a large repository in a very short time.
I guess a sign of good engineering is to have the intuition for an unexpected solution before the scientists have worked out all the facts, …and we did not need nuclear bomb explosions.
Physiology of color categorization
Up to today there have been quite a few people writing off color naming and categorization as unserious hogwash. As of today, we know of a possible physiological basis, giving us a little more credibility.
In fact, now we know that neurogenesis it taking place in the hippocampus of adult humans. Fresh adult neurons have a specific function facilitating cognitive plasticity in the hippocampus—for example, in helping the brain distinguish between things that belong to the same category, or comparing new information to what it has already learned from experience. The ability to distinguish between vermilion and pink, yet still identify both as flamingo colors, is one example of this type of task in humans.
Kirsty L. Spalding et al. have found that a large subpopulation of hippocampal neurons constituting one-third of the neurons is subject to exchange. In adult humans, 700 new neurons are added in each hippocampus per day, corresponding to an annual turnover of 1.75% of the neurons within the renewing fraction, with a modest decline during aging. They conclude that neurons are generated throughout adulthood and that the rates are comparable in middle-aged humans and mice, suggesting that adult hippocampal neurogenesis may contribute to human brain function.
Reference: Dynamics of Hippocampal Neurogenesis in Adult Humans, Kirsty L. Spalding, Olaf Bergmann, Kanar Alkass, Samuel Bernard, Mehran Salehpour, Hagen B. Huttner, Emil Boström, Isabelle Westerlund, Céline Vial, Bruce A. Buchholz, Göran Possnert, Deborah C. Mash, Henrik Druid, Jonas Frisén: Dynamics of Hippocampal Neurogenesis in Adult Humans. Cell, Volume 153, Issue 6, 1219-1227, 6 June 2013.
Wednesday, May 22, 2013
Time is not instantaneous
Science Now today reports on a transitive photon entanglement experiment by Eli Megidish, Hagai Eisenberg, and colleagues at the Hebrew University of Jerusalem in which they show that two photons can be entangled even when they do not exist at the same time. Entanglement is explained by the conservation of energy, and their experiment suggests that this conservation does not have to be in an instant point.
They first create a pair of entangled photons 1 and 2, then they produce a second pair 3 and 4. Then they perform a "projective measurement" on photons 2 and 3, which entangles them. The entanglement property (polarization) of photon 1 is measured, which destroys it. When the entanglement 2, 3 is created after 1 has been measured, 1 and 4 have never coexisted at the same time as an entangled pair. By later measuring 4, the experiment shows that 1 and 4 are entangled.
In the middle, the article states correctly, that entanglement cannot be used to transmit information faster than the speed of light, but in the last paragraph this fact is contradicted. In reality, entanglement can be used to determine if a cipher has been read, but it cannot be used to transmit ciphers.
Link to the article: Physicists Create Quantum Link Between Photons That Don't Exist at the Same Time
Saturday, April 27, 2013
HB-SIA

Two weeks ago, Switzerland started its new international tourism campaign, projecting a quaint image invented by Romantic writers like Friedrich Schiller and Johanna Spyri, with a few chaps from the Outback fighting in a Schwingen match. This suits well with the political majority party, who would like to place a cheese cloche over the country so it can live in a bubble.
Meanwhile, the Swiss fret over the 2050 energy package, ratified 25 May 2011, after Fukushima and the decision to exit nuclear energy generation. The slogan is that of the 2000-Watt Society, in which each person does not use more than 2000 W per day (today's average is 6000 W) and emits less than 1 Ton of CO2 per annum.
Such goals require the thought leadership of visionaries and effective demonstrators. Solar Impulse has been one of the best demonstrators. For example, in May 2012 it flew from Payerne across the Mediterranean to Rabat and Quarzazate, convincing the Moroccans that solar energy is the way of the future, supporting the plan by King Mohammed VI to construct the world’s largest thermo-solar power plant in Ouarzazate.
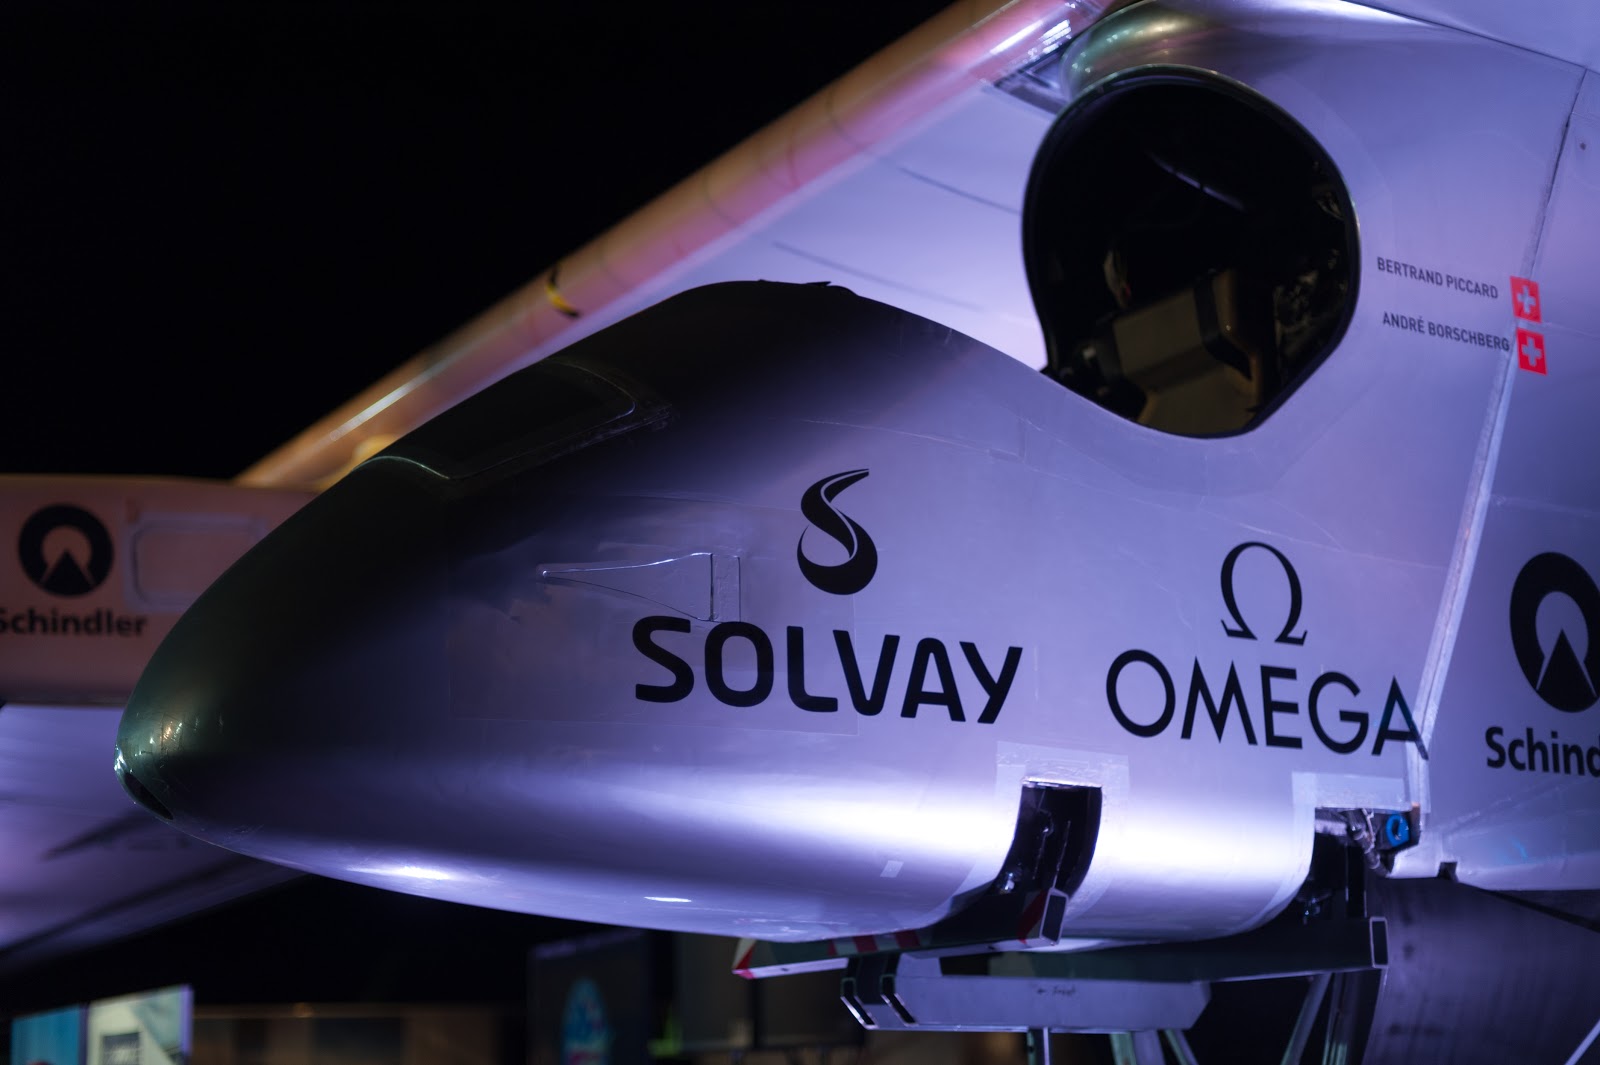
The visionaries behind Solar Impulse are Bertrand Piccard and André Borschberg, along with their sponsors and their big team.

The numbers of Solar Impulse are quite impressive: with a wingspan of 63.40 m it is the size of an Airbus A340 or a 747, but it weighs only 1,600 Kg, just a little more than a Prius. Its range is infinite, because it can fly perpetually, since it produces much more electricity than it consumes, just as the Swiss hope to do with their houses.

Currently Solar Impulse is in Hangar 2 at Moffett Federal Airfield at Ames Research Center, getting ready for the next mission.


Although the airplane can fly perpetually, in their 2015 flight around the world with the second model, license HB-SIB, Bertrand Piccard and André Borschberg will take turns every 5 days, because that is how long a trained human can stay awake and pilot, and also sit with very limited motion on the pilot seat/toilet combo:
On the first of May, Bertrand Piccard and André Borschberg will take off from Moffett Field at a speed of 44 km/h and fly their Across America mission, which will take them to Phoenix, Dallas, Saint Louis or Atlanta, Washington D.C., and finally JFK in New York City.
If you happen to look up and see a jumbo with license HB-SIA soaring silently at a speed of 70 km/h, think what you can do to give back more energy than you consume, so your total usage (think at those servers farms delivering your contents) is below 2000 W per day. In the case of the Solar Impulse, its 11,628 SunPower solar cells have an efficiency of 23% and drive the four brushless sensorless electric engines in addition of charging the batteries for when there is no sunlight.
Tuesday, April 16, 2013
Color naming 65,274,705,768 pixels
Where slide 6 is an approximate visualization of the spatial extent of the data analyzed.
Monday, April 15, 2013
Alpine Internet Speeds
The Swiss Federal Office of Communications has published a map of telecommunications in Switzerland. The map can show television availability, upload and download speeds, connection types, and the number of providers, all at a resolution of 250 meters. The publication also provides a guide to broadband expansion projects taking place in Switzerland. The goal of the publication is to help plan broadband access projects and to help users make smart decisions regarding telecommunications.

Link to the tool: broadband map (in German, French and Italian)
Scaling body size fluctuation
Flocks of birds, schools of fish, and groups of any other living organisms might have a mathematical function in common. Studying aquatic microorganisms, Andrea Giometto, a researcher EPFL and Eawag, showed that for each species he studied, body sizes were distributed according to the same mathematical expression, where the only unknown is the average size of the species in an ecosystem.
Taken together, these observations of size distributions within a species and within all the species in a given ecological community have interesting implications. If in an ecosystem several species begin to converge around the same size, a balancing force will kick in to restore the power-law distribution, either by acting on the abundance or size of each species.
Finding power-laws and using them to describe complex systems already has a successful track record. “In physics, the observation that systems followed power-laws was instrumental in understanding phase transitions. We believe that power-laws can be similarly helpful to gain a deeper understanding of how systems of living matter work,” says Giometto, a physicist, who is seeking to apply methods from his field to understand biological ecosystems.
Link to the paper: Scaling body size fluctuations
Sunday, April 7, 2013
Where is the sun?
When we take architectural pictures, we want to have the sun shining from the side, because this accentuates the edges. In the old days, this meant a shoot took two days, one to visit the sites of the buildings of interest to determine the best time, and a second day to do the actual shoots in a tour taking us to each building at the best time.
Today this is much easier. We can use an online tool like SunCalc to determine the best time.

In the box at the top left you enter the shoot location, then on the horizontal time scale you simply drag the orange dot. On the map, the thick orange segment indicates the sunlight direction. Just move the orange dot on the slider until the segment hits the façade more or less perpendicularly. You can enter the data into a spreadsheet, which you sort by the time, to get your itinerary.
By they way, the thin orange curve is the current sun trajectory, and the yellow area around is the variation of sun trajectories during the year. The closer a point is to the center, the higher is the sun above the horizon. The colors on the time slider above show sunlight coverage during the day.
Sunday, March 31, 2013
Color language
Yesterday we received in the mail this year's first issue of the Atti della Fondazione Giorgio Ronchi (volume LXVIII). On pages 97–106 we found a paper by Lucia Ronchi with the intriguing title Familiarizing with color language I — Evolution and written language. This paper was instigated by the author's reading of Carole Biggam's recent book Semantics of Colour Vision.
Prof. Ronchi compares the frequency and category of color terms in a number of books in Italian, from the an early Psalterium through Dante to contemporary books. The work was accomplished by actually reading the texts and analyzing the color terms in reference to the surrounding text; a more detailed study is promised to appear in a second paper.
This detailed analysis of a few texts is rare in these days, where we tend to study large corpora using big data analytics, as we did for example in the post on which color synonym should I use?
Not having read Biggam's book, the article is in part a little obscure. For example, in the abstract we are given the expectation to read about the relation of studying color terms (linguistics) vs. color categories (cognition), but this is used only intrinsically. Also, we are promised a comparison between color terms and categories in the written and oral languages, but the article covers only the former.
Thursday, February 14, 2013
Using Exchange process mailboxes with Java
In a world where servers are under constant attack, the wise will use the few facilities that can be easily hardened in a firewall and with defensive programming, like servlets. Sometimes it is useful to have something more simple than a web service, such as an email service. For example, you could take a picture with your mobile device and mail it to mostlycolor for a consultation by an automated color advisor.
It is easy to find the information to quickly code up an email client using the JavaMail API and the JavaBeans Activation Framework. Suppose your email is martin.muster@mostlycolor.ch with password !@#$% and your host is mailhub.mostlycolor.ch. You the access your mailbox with the simple statement
store.connect ("mailhub.mostlycolor.ch", "martin.muster@mostlycolor.ch", "!@#$%");
In practice, you do not want to use your mailbox for an automated service, but you want to use a so-called process mailbox on your Exchange server, say color.advisor@mostlycolor.ch. This seems obvious, but I was not able to formulate the correct query to find out how to access a process mailbox. Here is what I found out by trial and error.
Suppose your domain is americas and your login name is musterm. The connect statement then becomes
store.connect ("mailhub.mostlycolor.ch", "americas\\musterm\\color.advisor@mostlycolor.ch", "!@#$%");
Pretty simple once you know the syntax!
Tuesday, February 12, 2013
New SPIE open access program
As of January 2013, all new articles published in SPIE journals for which authors pay voluntary page charges are open access immediately on the SPIE Digital Library. SPIE asks journal authors (and their employers or other funders of their research) to provide such support to enable SPIE to hold down subscription prices and maximize access to the research published in SPIE journals. Many authors and institutions provide this support and will now obtain open access for their articles by doing so.
Increasingly, employers and research funders require authors to publish their articles with open access and authors want to do so in order to expand the reach of their research. SPIE provides the benefit of immediate open access for all articles for which voluntary page charges are paid. In these cases, authors retain copyright and SPIE licenses these articles under the Creative Commons Attribution license (CC-BY 3.0).
SPIE recognizes that researchers have modest funds to cover publication expenses. The voluntary page charges will continue to be low: $100 per published two-column page (for journals with both print and online formats) and $60 per published one-column page (for journals with an online format only).
For more information see http://spie.org/x85022.xml
Subscribe to:
Posts (Atom)


