Showing posts with label innovation. Show all posts

Monday, March 26, 2018

Stanford Workshop on Medical VR and AR

5 April 2018, there will be a public workshop on medical head-mounted displays in Stanford. The workshop is designed to support collaborations between the engineers who are developing VR and AR technologies and the surgeons and clinicians who are using these technologies to treat their patients.

The workshop features talks by researchers who are developing VR and AR technologies to advance healthcare and panel discussions with Stanford physicians who are using VR and AR applications for surgical planning and navigation and for alleviating pain and anxiety in their patients.

There will be an interactive demo session featuring research projects, clinical applications, and startup ventures.

Seating is limited, so if you wish to attend, we recommend that you register now at the website https://scien.stanford.edu/index.php/medicalvrar.

Stanford Workshop on Medical VR and AR

Thursday, February 9, 2017

mirror mirror on the wall

Last November, I mentioned an app that makes you look like you are wearing a makeup when you do a teleconference. Now Panasonic lets you take it a step further. A new mirror analyzes the skin on your face and prints out a makeup that you can apply directly to your face.

The aim of the Snow Beauty Mirror is “to let people become what they want to be,” said Panasonic’s Sachiko Kawaguchi, who is in charge of the product’s development. “Since 2012 or 2013, many female high school students have taken advantage of blogs and other platforms to spread their own messages,” Kawaguchi said. “Now the trend is that, in this digital era, they change their faces (on a photo) as they like to make them appear as they want to be.”

When one sits in front of the computerized mirror, a camera and sensors start scanning the face to check the skin. It then shines a light to analyze reflection and absorption rates, find flaws like dark spots, wrinkles, and large pores, and offer tips on how to improve appearances.

But this is when the real “magic” begins. Tap print on the results screen and a special printer for the mirror churns out an ultrathin, 100-nanometer makeup-coated patch that is tailor-made for the person examined. The patch is made of a safe material often used for surgery so it can be directly applied to the face. Once the patch settles, it is barely noticeable and resists falling off unless sprayed with water.

The technologies behind the patch involve Panasonic’s know-how in organic light-emitting diodes (OLED), Kawaguchi said. By using the company’s technology to spray OLED material precisely onto display substrates, the printer connected to the computerized mirror prints a makeup ink that is made of material similar to that used in foundation, she added.

Read the full article by Shusuke Murai in the Japan Times News.

Panasonic Corp. engineer Masayo Fuchigami displays an ultrathin makeup patch during a demonstration of the Snow Beauty Mirror

Panasonic Corp. engineer Masayo Fuchigami displays an ultrathin makeup patch during a demonstration of the Snow Beauty Mirror on Dec. 1 in Tokyo. | Shusuke Murai

Wednesday, February 8, 2017

Konica Minolta, Pioneer set to merge OLED lighting ops

Konica Minolta and Pioneer are concluding talks to merge their OLED lighting businesses under a 50–50 joint venture as early as spring. The Japanese companies will spin off their organic light-emitting diode development and sales operations into a new venture that will be an equity-method affiliate for both.

The two companies aim primarily to gain an edge in the automotive OLED market, which is seen expanding rapidly. Konica Minolta's strength in bendable lighting materials made with plastic-film substrates will be combined with Pioneer's own OLED expertise and broad business network in the automotive industry. Taillights and interior lighting are likely automotive applications.

Read the full story in Nikkei Asian Review.

Friday, November 11, 2016

App adds makeup to faces on video conferences

In a potential boost for the government’s drive to get more people telecommuting, cosmetics company Shiseido Co. has developed an app that makes users look as if they are wearing makeup. It amounts to an instant makeover for the unfortunate worker called to appear on screen from home at an awkward hour.

Read the article in the Japan Times.

Yoko's lips

Thursday, July 21, 2016

Virtual energy production and delivery at IWB

In our post on the virtual print factory, we saw how an art director can be simulated and used in a simulated press check to optimize print production. There are other applications that can be revolutionized through the online simulation of production. Today, we have a look at the future of energy production and delivery. Society is improved by making it more efficient.

In 1852 Basel, the private company Gasindustrie was founded and in 1867 it was nationalized. Over the years other utilities were added: water delivery, water production, electricity, long-distance heating, refuse processing, and a fiber network for broadband internet and telephony. The name became IWB, forIndustrielle Werke Basel. It was privatized in 2010 (CEO David Thiel), but all shares belong to the Canton Basel-City. IWB is responsible for the supply of energy, water, and telecom; it has a mandate to optimize its operations (smart IWB 2020).

During industrialization, like in most countries, Switzerland's main energy source was coal. After World War I, not having coal mines, Switzerland boosted the education of engineers, who could then electrify the country. For example, the Crocodile locomotive was an engineering feat that could pull up a freight train on the Gottardo line. Actually, the regenerative braking energy from two trains could pull up one train on the other side of the Alps. When in the 1930s the regime in Germany started flexing its muscle and using its coal to wield power, Switzerland invested considerable brain power to wean away from coal as much as possible. For example, the cantonal buildings in Zurich are heated with heat pumps extracting heat from the Limmat.

The ETH cranked out generation after generation of skilled engineers who designed hydroelectric dams, turbines, and power distribution systems. Many plants were of the pump type, consisting of an upper and a lower reservoir: during the day water falls and generates power, while at night cheap electricity is imported from fixed throughput plants to pump the water back up.

This history is reflected in IWB's energy sources. In 2015, the energy sources for electricity in percent were

hydroelectric
96.14
wind
0.22
solar
0.14
other renewable
3.50

In the 4th quarter of 2015, on the European domestic market, the cost of a kilowatt-hour (kWh) of power was 3.3 cents. However, in Basel, at the public car charge boxes, the consumer price varies between 45 and 70 cents per kWh. This is an opportunity to increase efficiency. Smart IWB 2020 aims at reducing and stabilizing the end-user energy costs.

The old big central power plants will remain and keep producing and storing energy. New small decentralized systems have been built to produce and store energy at the regional level. Now, end-users are starting to produce, store, and consume energy. Excess energy is shared at the neighborhood level.

This is how a 1 MW lithium-metal-oxide battery in Zurich looks like:

1 MW lithium-metal-oxide battery in Zurich

End-users must also store energy in some form to even out the network dependence during the day. There may be excess solar energy in the afternoon and a lack of energy during a cold winter night.

each house has a facility to store excess energy

This is made possible by the new control network shown in dark gray in the figure below (for an animation see here). IWB can collect data everywhere on the network and feed it to its simulation that allows it to optimize the overall energy generation and conversion system.

Smart IWB 2020. The control network is shown in dark grey

Electricity companies have been using simulations for many years. For robustness, a distribution system cannot have a tree topology, because a failure at a node will black out the entire subtree. The required mesh topology is difficult to manage because the system has to be kept in equilibrium, otherwise, a failure will cascade to a blackout of the entire network.

What is new with smart IWB 2020, is that the regulation is no longer made by dropping more water when the network frequency drops under 49.8 Hz and by pumping up water when the frequency rises over 50.2 HZ. As the figure above shows, there are many more sources for electricity that have to be synchronized and balanced out.

In 2000, Germany introduced a law to subsidize renewable energies by guaranteeing the producers a profit, i.e., by taking out a major part of their risk to conduct business. In 2004, the European Union liberalized the power market, adding to the mix the windmill farms in Denmark among others. In Germany alone, renewable energy production surged from 6,277 GWh in 2000 to 153,000 GWh in 2015.

The availability of this low-cost renewable energy from the north wrecked havoc in the business model of the Swiss generators, who were generating expensive electricity during the day by draining the high reservoirs and importing cheap electricity at night to pump up the water from the low reservoirs. Today, solar plants in Germany deliver the maximum energy around noon, exactly the time when pump plants in the Alps used to generate the highest profits.

According to Alpiq CEO Jasmin Staiblin (SFR 25 April 2016), the producer Alpiq can generate only ¼ of its hydropower at a profit, while ½ breaks even and ¼ is sold at a loss. On average, to Alpiq, hydropower generation costs 6.5 cents per kWh, twice the European market price. Even at its newest generation facilities with the latest turbine designs, the cost is 3.8 respectively 4.5 cents per kWh. Alpiq expects that next year or the year after, the open market price will sink to 2 cents per kWh or even slightly less.

The numerous nuclear power plants in France and Switzerland, while also causing losses to the hydroelectric generators, cannot compete with the renewable sources. At the Gösgen nuclear power plant, production costs in 2014 were 3.4 cents per kWh. In 2015 they were 5.1 cents per kWh, but this was due to accounting changes and costs are supposed to sink again, but 3.4 > 2. According to GE Chief Productivity Officer Philippe Cochet in Fairfield CT (NZZ 13 January 2016), before the 2008 financial crisis, in Europe each year 7 GW of new power generation capacity was sold; after the crisis, sales dropped to 1.3 GW and in the past two years sales were less than 1 GW.

The solution is to use online simulations to not just optimize electric power generation, but all energy management: electricity, hot steam for electricity production, hot water for heating, and warm water for washing. Heat is produced by burning refuse, natural gas, biomass (wood refuse), etc. It is also recovered from data centers, instead of dispersing it in the atmosphere through air conditioning chillers. This photograph by Mathias Leemann shows the refuse burning plant of Basel.

Refuse burning plant Basel; photo by Mathias Leemann

Heat can be stored in water, soil, and stones, as has been done since Roman times. A more contemporary method used by IWB is the use of fuel cells. When there is excess electricity, electrolysis of water is used to generate hydrogen. Hydrogen is also produced from natural gas when consumption is low. This hydrogen is easy to store. When electricity prices are high, hydrogen fuel cells are used to generate electricity.

Coordinating and timing all these sources, stores, carriers, and consumers of energy is a very complex task. When IWB will sell its electricity at the public charge boxes (photograph by Simon Havlik) around the Canton for a much lower price than today's 45 to 70 cents per kWh, cars based on burning fossil fuels will disappear very fast. Such is the impact of smart energy management.

IWB charge box; photograph by Simon Havlik

So far, we have seen how the online simulation of a complex energy provision system can considerably reduce the cost of energy. However, this does not yet help with the goal of the 2000 Watt Society. If we build our houses with recycled glass shards in the outer concrete walls, then use 12 cm of insulation and cover it with 16 cm of solid wood on the inside, and also give up private ownership of cars, we might achieve a 3500 Watt Society, said ZHAW sustainability expert Prof. Andreas Hofer (SRF 26 November 2015).

50 years ago, people got by with less than 2000 Watt. Where is the problem? It is not at the individual level but at the society level. We have become much more mobile: if you live in Lugano, you not longer go to San Moritz for an extended weekend, but to Paris. Also, we have become digital packrats. All over the world, we have huge server farms that store all that digital media we never consume but is valuable for social network companies to dissect our lives and sell us stuff we do not really need.

Back to the virtual print factory:

virtual print factory

The output of the prepress stage is a PDF file. The two presses take raster images, therefore the computer in front of the press has to do the ripping and is called the digital front-end. In John L. Recker et al.; Font rendering on a GPU-based raster image processor; Proc. SPIE 7528 (January 18, 2010), the authors calculated that over a year of usage, the regular front-end RIP consumed 38,723 kWh and generated 23,234 Kg of CO2, while for the GPU-RIP they built, the corresponding numbers are 10,804 kWh and 6,483 Kg.

This is the kind of innovation that is required to achieve the 2000 Watt Society at the society level rather than at the individual level. There is still a lot of work to do. We recently wrote that the internet of things is a power guzzler: fortunately the cited report has some good advice.

Wednesday, June 22, 2016

9,355,339: system and method for color reproduction tolerances

In the early days of digital imaging for office use, there was a religion that the response of the system had to be completely neutral. The motivation came from a military specification that a seventh generation copy had to still look good and be readable. If there would be a deviation from neutrality, every generation would enhance this deviation.

When a Japanese manufacturer entered the color copier market, they enhanced the images to improve memory colors and boost the overall contrast. They were not selling to the government and rightfully noted that commercial users do not do multiple generation copies.

Color is not a physical phenomenon, it is an illusion and color imaging is about predicting illusions. Visit your art gallery and look carefully at an original Rembrandt van Rijn painting. The perceived dynamic range is considerably larger than the gamut of the paints he used because he distorted the colors depending on their semantics. With Michel Eugène Chevreul's discovery of simultaneous contrast, the impressionists then went wild.

When years later I interviewed for a position in a prestigious lab, I gave a talk on how—based on my knowledge of the human visual system (HVS)—I could implement a number of algorithms that greatly enhance the images printed on consumer and office printers. The hiring engineering managers thought I was out of my mind and I did not get the job. For them, the holy grail was the perfect neutral transmission function.

This neutral color reproduction is a figment of imagination in the engineer's minds in the early days of digital color reproduction. The scientists who earlier invented the mechanical color reproduction did not have this hang-up. As Evans observed on page 599 of [R.M. Evans, “Visual Processes and Color Photography,” JOSA, Vol. 33, 11, pp. 579–614, November 1943], under the illuminator condition color constancy mechanisms in the human visual system (HVS) correct for improper color balance. As Evans further notes on page 596, we tend to remember colors rather than to look at them closely; for the most part, he notes, careful observation of stimuli is made only by trained observers. Evans concludes that it is seldom necessary to obtain an exact color reproduction of a scene to obtain a satisfying picture, although it is necessary that the reproduction shall not violate the principle that the scene could have thus appeared.

We can interpret Evans’ consistency principle (page 600) as what is important is the relation among the colors in a reproduced image, not their absolute colorimetry. A color reproduction system must preserve the integrity of the relation among the colors in the palette. In practice, this suggests that three conditions should be met. The first is that the order in a critical color scale should not have transpositions, the second is that a color should not cross a name boundary, the third is that the field of reproduction error vectors of all colors should be divergence-free. The intuition for the divergence condition is that no virtual light source is introduced, thus supporting color constancy mechanisms in the HVS.

We all know the Farnsworth-Munsell 100 hue test. The underlying idea is that when an observer has poor color discrimination, either due to a color vision deficiency or due to lack of practice, this observer will not be able to sort 100 specimen varying only in hue. In the test, the number of hue transpositions is counted to score an observer.

Farnsworth-Munsell 100 hue test

We can considerably reduce the complexity of a color reproduction system if we focus on the colors that actually are important in the specific images being reproduced. We can minimally choose the quality of the colorants, paper, halftoning algorithm, and the number of colorants to just preserve the consistency of that restricted palette.

First, we determine the palette, then we reproduce a color scale with a selection of the above parameters and we give the resulting color scale image a partial Farnsworth-Munsell hue test. This is the idea behind invention 9,355,339. The non-obvious step is how to select color scales and how to use a color management system to simulate a reproduction. The whole process is automated.

A graphic artist manually identifies the locus of the colors of interest, which is different for each application domain, like reproductions of cosmetics or denim clothes. A scale encompassing these critical colors is built and printed in the margin. In the physical application, the colors are measured and the transpositions are counted.

complexion color scale

The more interesting case is a simulation. There is no printing, just the application of halftoning algorithms and color profiles. The system extracts the final color scale and identifies the transpositions compared to the original. Why is the simulation more important?

Commercial printing is a manufacturing process and workflow design is crucial to the financial viability of the factory. Printing is a mass-customization process, thus every day in the shop is different. This makes it impossible to assume a standard workload.

For each manufacturing task, there are different options using different technologies. For example, a large display piece can be printed on a wide bubblejet printer, or the fixed background can be silkscreen printed and the variable text can be added on the wide bubblejet printer. Another example is that a booklet can be saddle stitched, perfect bound, or spiral bound.
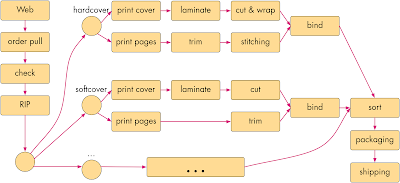
print fulfillment diagam

In an ideal case, a print shop floor can be designed in a way to support such reconfigurable fulfillment workflows, as shown in this drawing (omitted here are the buffer storage areas).

example of a print fullfillment floor rendering; the buffer zones are omitted

However, this would not be commercially viable. In manufacturing, the main cost item is labor. Different fulfillment steps require different skill levels (at different salary levels) and take a different amount of time.

Additionally, not all print jobs are fulfilled at the same speed. A rush job is much more profitable than a job with a flexible delivery time. To stay in business, the plant manager must be able to accommodate as many rush jobs as possible.

This planning job is similar to that of scheduling trains in a saturated network like the New Railway Link through the Alps (NRLA or NEAT for Neue Eisenbahn-Alpentransversale, or simply AlpTransit). For freight, it connects the ports of Genoa and Rotterdam, with an additional interchange in Basle (the Rotterdam–Basel–Genoa corridor). For passengers, it connects Milan to Zurich and beyond. There are two separate basis tunnel systems: the older Lötschberg axis and the newer Gotthard axis. In the latter, freight trains travel at least at 100 km/h and passenger trains at least at 200 km/h. These are the operational speeds, the maximal speed is 249 km/h, limited by the available power supply.

The trains are mostly of the freight type, traveling at the lower operational speed. A smaller number of passenger trains travels at twice the operational speed. A freight train can be a little late, but a passenger train must always be on time lest people miss their connections, which is not acceptable.

The trains must be scheduled so that passenger trains can pass freight trains when these are at a station and can move to a bypass rail. However, there can be unforeseen events like accidents, natural disasters, and strikes that can delay the trains on their route. The manager will counter these problems by accelerating trains already in the system above their operational speed when there is sufficient electric power to do so. This way, when the problem is solved, there is additional capacity available.

The problem with modifying the schedule is that one cannot just accelerate trains: new bypass stations have to be determined and the travel speeds have to be fine-tuned. Train systems are an early implementation of industry 4.0 because the trains also automatically communicate between each other to avoid collisions and to optimize rail usage. For AlpTransit this required solving the political problem of forcing all European countries to adopt a new ERTMS/ETCS (European Train Control System) Level 2, to which older locomotives cannot be upgraded.

The regular jobs and rush jobs in a print fulfillment plant are similar. The big difference is that the train schedule is the same every day, while in printing each day is completely different. The job of the plant designer is to predict the bottlenecks and do a cost analysis to alleviate these bottlenecks. In particular, deadlocks have to be identified and mitigated. There are two main parameters: the number and speed of equipment, and the amount of buffer space. Buffering is highly nonlinear and cannot be estimated by eye or from experience. The only solution is to build a model and then simulate it.

We used Ptolemy II for the simulation framework and wrote Java actors for each manufacturing step. To find and mitigate the bottlenecks, but especially to find the dreaded deadlock conditions, we just need to code timing information in the Java actors and run Montecarlo simulations.

We used a compute cluster with the data encrypted at rest and using Ganymed SSH-2 for authentication with certificates and encryption on the wire. Each actor could run on a separate machine in the cluster. The system allows the well-dimensioned design of the plant, its enhancement through modernization and expansion, and the daily scheduling.

So far, the optimization is just based on time. In a print fulfillment plant, there are also frequent mistakes in the workflow definition. The workflow for a job is stored in a so-called ticket (believe me, reaching a consensus standard was more difficult than for ERTMS/ETCS). One of the highest costs in a plant is an error in the ticket, which causes the job to be repeated after the ticket has been amended. With this, risk mitigation through ticket verification is a highly valuable function, because it allows a considerable cost reduction for not having to allocate insurance expenses.

While in office printing A4 or letter size paper are the norm, commercial printers use a possibly large paper size to save printing time and, with it, cost. This means there are ganging and imposition, folding, rotating, cutting, etc. It is easy to make an imposition mistake and pages end up in the wrong document or at the wrong place. Similarly, paper can be cut at the wrong point in the process or folded incorrectly.

Once we have a simulation of the print fulfillment factory, we can easily solve these workflow problems, thus reducing risk and with it insurance cost. The data for print jobs is stored in portable document format (PDF) files. For each workstation in a print fulfillment plant, we take the Java actor implemented for the simulation and add input and output ports for PDF files. We then implement a PDF transformer for each workstation that applies the work step to the PDFs. There can be multiple input and output PDFs. For example, a ganging workstation takes several PDF files and outputs a new PDF file for each imposed sheet.

Most errors happen when a ticket is compiled. After simulating the workflow, the operator simply checks the resulting PDF files. A mistake is immediately visible and can be diagnosed by looking at the intermediate PDF files. A more subtle error source is when workstations negotiate workflow changes in the sense of the industry 4.0 technology. Before the change can be approved, the workflow has to be simulated again and the difference between the two output PDF files has to be computed.

A more valuable, but also more complex workflow change is accommodating rush jobs by taking shortcuts. For example, if there is a spot color in the press, can we reuse the same color or do we have to clean out the machine to change or remove the spot color? Another example is the question of using dithering instead of stochastic halftoning to expedite a job. Finally, earlier we mentioned the possibility of running a fixed background through a silkscreen press and printing only the variable contents on a bubblejet press.

In a conventional setting, any such change requires doing a new press-check and having the customer come in to approve it. In practice, this is not always realistic and the owner will use his best judgment so self-approve the proof.

9,355,339 automates this check and approval. The ICC profiles are available and can be used to compute the perceived colors in each case. The transposition score for the color scale (there can be more than one) can predict the customer's approval of the press-check.
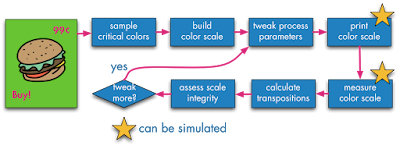
9,355,339 automates the press-check and approval

Thus, we have created a Java actor that simulates a human and can predict the human's perception. This is an industry 4.0 application where we not only have semantic models for the machines but also for the humans, and the machines can take the humans into consideration.

simulating the human in the loop

Wednesday, August 12, 2015

9,098,487: categorization based on word distance

One of the correlates for the social appreciation or value of scientists is the Gini coefficient. Indeed, poor people cannot afford technologies that make their lives more comfortable (and would not be able to amortize the investment anyway because their labor has little value). Rich people also cannot necessarily amortize the investment in new technology, because they can just hire the poor to do the work for them for a low pay. What drives technology is a low Gini coefficient, because it is a broad middle class that can and does invest in new technologies that makes their lives more efficient.

Worldwide, over the past two centuries the Gini factor has been on the rise, yet there has been incredible technological progress. This means we have to look at a smaller geographical scale. Indeed, for the late 2000s, the United States had the 4th highest measure of income inequality out of the 34 OECD countries measured, after taxes and transfers had been taken into account. As it happens, except for the medical sciences, the American science establishment is only a pale shadow of what it was half a century ago.

In this context, we were naive when three years ago we embarked to solve an efficiency problem for customers processing medical bills, invoices and receipts. These artifacts are still mostly on paper and companies spend a huge amount of time having minimum wage people ingesting it for processing in their accounting systems. In the datasets we received from the customers, the medical bills were usually in good physical shape, but the spelling checkers in the OCR engines had a hard time cracking the cryptic jargon. Receipts were in worst physical shape, printed on poor printers and crumpled, and often imaged by taking a picture with a smart phone.

Surprisingly, invoices were also difficult to process. They often had beverage stains and sometimes they had been faxed several times using machines that looked like they had mustard on the platen and mayonnaise under the lid. But the worst was that in the datasets we received, the form design of the invoices was very inconsistent: the fields and their labels were all over the place, many gratuitous and inconsistent abbreviations were used, etc.

Considerable effort had been spent in the 80s to solve this problem by people like Dan Bloomberg with his mathematical morphology methods to clean up the scanned images (Meg Withgott coined the phrase "document dry cleaning") and Rob Tow with David Hecht and others invented the glyph technology to mark forms so that the location and semantics of each field could be looked up. Maybe due to the increasing Gini coefficient they were not commercially successful. However because this time we had actual customers, we decided to give it another go.

Note that OCR packages already have pretty good built-in spelling checkers, so we are dealing with hard cases. The standard approach used in semantic analysis is based on predetermining all situations for a lexeme and store them into NoSQL databases. In our applications this turned out to be too slow: we needed a response time under 16 µs.

Looking at our dataset, we had a number of different issue types:

  • synonym: a word or phrase that means exactly or nearly the same as another word or phrase in the same language
  • abbreviation: a shortened form of a word or phrase
  • figure of speech: a word or phrase used in a nonliteral sense to add rhetorical force to written passage
  • misspelling: a word or phrase spelled incorrectly
  • mistyping: like misspelling, but depends on the distance between the keys on a keyboard or the stroke classes in the OCR engine
  • metonym: a word, name, or expression used as a substitute for something else with which it is closely associated
  • synecdoche: a figure of speech in which a part is made to represent the whole or vice versa
  • metalepsis: a figure of speech in which a word or phrase from figurative speech is used in a new context
  • kenning: a compound expression in Old English and Old Norse poetry with metaphorical meaning
  • acronym: an abbreviation formed from the initial letters of other words and pronounced as a word

In addition to computational speed, we wanted to be able to address each of these constructs explicitely. In the following we call a lexeme "category" because the used process is a categorization more than a linguistic analysis.

We solved the problem by introducing a metric, so that we could deal with everything as distances and intervals. For the metric we chose the edit distance, also known as Levenshtein distance: the number of edits used to change a first word in the category into a second word in the category, such as using additions, deletions, substitutions, and transpositions. This metric can be computed very fast. We also tried the Damerau-Levenshtein distance, but in this application it did not make a difference.

With a metric, everything was simple. We took the lexemes in each category and computed the center of gravity to determine the prototype for each category and the diameter of the category. The category then received a label that is the word or phrase used in the document typing application.

interval of a lexeme

With misspellings the diameters could be small, but with with synonyms and figures of speech the intervals could be quite large and can overlap. The intersections could easily be computed. Because in all three out datasets the dictionaries were small, we easily resolved the overlaps visually by constructing a graph in which each node had the category diameter as the value and the edges between two nodes had their Levenshtein distance as a weight. Then we plotted the graph with Gephi and split up the overlapping categories into smaller one with the same label.

With this, document typing became very fast: for each word or phrase we looked into which category it fell, and in there we looked for a match. When there was one, we replaced it with the lexeme's label, when not, we added it to the category and logged it for manual verification.

Patent 9,098,487 was filed November 29, 2012 and issued August 4, 2015.

Wednesday, June 18, 2014

Color facsimile flashback

Recently a friend showed me on YouTube a movie called Silicon Valley. The movie mostly introduced characters and their environment, finishing without a conclusion, so I suspect it is an episode from a TV series. The setting is a stereotype of the Web 2.0 Silicon Valley and a good part of the plot took place in a company called Hooli, a mini version of real world Google.

If you live in the Silicon Valley the movie might be boring. However, the technology the main character is supposed to have invented got my attention. It is supposed to be a lossless compression algorithm for audio files that can achieve a compression rate of 1:100. Of course, this is impossible as described in the movie, because on a stypical file the lossless compression rate using the Deflate algorithm (Lempel-Ziv followed by Huffman) is about 1:3. The description in the movie is impossible because there is not that much entropy in typical audio files.

Indeed, the writer forgot a qualifier, such as perceptually or better should have written about listening performance.

On that, my colleagues and I happen to have a couple of patents, namely US 5,883,979 A Method for selecting JPEG quantization tables for low bandwidth applications and US 5,850,484 A Machine for transmitting color images.

U.S. Patent 5,883,979 Method for selecting JPEG quantization tables for low bandwidth applications

Facsimile (fax) is an old technology for transmitting images over phone lines that is probably alien to today's readers. In analog fax, the machine consisted of a metal cylinder on which one would affix the page of a document. On the sender side, a head would shuttle in the fast scan direction and at the end of the cylinder the head would shuttle back while the cylinder rotates by one scan line in the slow direction. During the first shuttle, a photosensor in the head would produce a sound in the phone line each time it encounters a black photosite.

At the receiving end, a similar machine would move synchronously and each time a sound arrives in the phone line, it would produce a spark that would burn a dark spot in the paper.

This process was extremely slow, so it would be used only for dense documents. For text documents one would retype the document on a telex machine, which produces a legally valid copy of the text.

Forty years ago I was using fax all the time. When as a field engineer I had an OS crash I could not figure out, I would print out the core dump as a hexadecimal string and fax it from Zürich to Goleta, where the R&D division was. At the time email was not encrypted and people at any forwarding node could and did read the messages. Furthermore, telex was a European thing that was not commonly used in the USA.

A revolution happened in 1964, when Xerox invented the telecopier, which was based on a digital fax technology. The machine would convert the photosites into zeros and ones and store them in a buffer as a digital string. This string would be compressed before being transmitted. There was a hierarchy of compression algorithms that could use 1-d , 2-d coding schemes or pattern matching, with names like MH (ITU T.4), MR, MMR (T.6) and JBIG (T.85).

Having a digital signal that can be compressed with mathematical algorithms, the transmission time dropped dramatically from an hour to under two minutes per page with a typical 9600 baud modem of the time. A dozen years after the Xerox telecopier, Japanese companies were producing very affordable fax machines that became ubiquitous. In Japan, every household had a fax machine, because you could handwrite kanji text on a sheet of paper and fax it, while typing kanas was rather slow.

In 1994 I joined a team inventing the color fax technology. The international effort took place under the ITU umbrella as T.42. For the color encoding we used CIELAB, because being perceptually uniform it allowed the most compact representation. For the spacial encoding we used JPEG.

Compression methods used in color fax

At that time, digital color imaging was still in its infancy (in Windows 3.1 you could only have 16 device colors by default) and the early inkjet printers were fuzzy, as were the early color scanners of the time. The signal processing researchers on the team applied spacial filters to improve the quality of the images, but this actually made the images look worse because the compression artifacts were being amplified.

Artifacts in color fax text

I had the crazy idea of transforming the sharpening algorithm itself to the cosine domain. There the sharpening function could be expressed as a transformation of the DQT, or the quantization tables for the 64 kernels of the discrete cosine transform. We called this image processing in the compressed domain and essentially it consisted in lying about the DQT. For the JPEG encoding we used DQTs optimized for the input image, while the DQT included in the JPEG image was a transformed DQT including the sharpening. This is the essence of patent US 5,850,484.

Office documents consist of a combination of text and image data or mixed raster content (MRC, see here), so we would segment the document stripe by stripe and compress the foreground for example with JBIG, the mask with MMR and the background with JPEG. The ITU standards were T.44 for MRC and T.43 for JBIG in CIELAB.

Even so, transmitting the test targets (e.g., 4CP01) over a 9600 baud line would take 6 minutes per page, which in 1994 was considered unacceptable. At that time the experience was that when a device transitions from black-and-white to color, the price could be at most 25% more and the performance would have to be the same. We felt that a color fax could not take longer than 2 minutes per page on a 9600 baud connection. We achieved 90 seconds.

This prompted us to investigate perceptually lossy compression. In lossless compression, after decompression we obtain exactly the same data as in the input file. In perceptually lossless compression like JPEG or MPEG-2 Audio Layer III (a.k.a. MP3), after decompression we obtain less data, but we cannot perceive the difference. In other words, we leave out the information we cannot perceive anyway. The cosine transform makes the discretization straightforward.

This is like in color encoding we can transform the images to the CIELAB color space because it is perceptually uniform and one unit corresponds approximatively to a JND (just noticeable difference), so we can discretize from floating point to integer without perceiving a difference.

Staying with color, the next step is to further discretize the colors, so that we can perceive a difference (perceptually lossy), but it does not impair our ability to make correct decisions based on the degraded images. This had led us to color consistency and using color names to compare colors. This is related to cognitive color and categorization.

The analogue for the text in mixed documents is reading efficiency, i.e., our reading performance is not reduced based on reading speed or the ability to ready without errors. This is covered by patent 5,883,979, which I explained in this SPIE paper:

Giordano B. Beretta ; Vasudev Bhaskaran ; Konstantinos Konstantinides and Balas R. Natarajan "Perceptually lossy compression of documents", Proc. SPIE 3016, Human Vision and Electronic Imaging II, 126 (June 3, 1997); doi:10.1117/12.274505; http://dx.doi.org/10.1117/12.274505.

perceptually lossy compression

This is a long explanation and you cannot do it in a movie, but at least the script writer should have added the qualifier perceptual in the algorithm name and it would all have been more plausible.

Epilogue

If the invention is sufficiently novel that it can become the basis for a plot in a Hollywood movie twenty years later, why was my professional career a failure? As it happens, 1994 was also the time when the Internet became available to the general public and everybody went on email. An email attachment is more convenient than having a separate fax machine, especially in a crammed Japanese house. Also, the Internet was running on fiber to the home (FTTH) instead of the slow copper phone lines of the phone and fax.

Timing is everything.

Thursday, June 5, 2014

3D print of van Gogh's ear

Vincent van Gogh self-portrait with bandaged ear, 1889

The German artist Diemut Strebe used a 3D printer at a Boston hospital to create a replica of Vincent van Gogh's ear. Strebe said the copy of the ear uses DNA material from Lieuwe van Gogh, the great-great-grandson of Theo Van Gogh, Vincent's brother.

The artifact is on display at the Center for Art and Media in Karlsruhe, Germany through July 6.

Source: Los Angeles Times

Sunday, May 18, 2014

Old telecoms should be let to die

Today's techno-melodrama is on the damage old incumbent telecoms like AT&T are doing to the American economy by reducing our efficiency as their customers. We should just let them die of natural causes and move our service as soon as we can to newer technologically savvy companies.

In 1984, when I started working at Xerox PARC, I did not get a plain old telephone. Instead, at PARC we were using the Etherphone, which was packet based instead of being circuit based like plain old telephone service (POTS). We were wearing active badges, so the Etherphone system knew where we were in the building. When a phone call came in (this was before robocalls) the system would transfer the call to the nearest phone and play our personal tune (Doug Wyatt had skillfully arranged a Beethoven Prélude for my tune). To make a call, you could either dial a number, or just type "phone jane doe" in a command tool viewer and the Etherphone would look up Jane's number in the phone book and initiate the call.

Not being a great communicator, at home I have kept living for the last 30 years with the same anti-diluvial POTS from Ma' Bell. This was until May 7, 2014 when I made the bad decision to switch to AT&T's voice over IP (VoIP) service. More precisely, the bad part of the decision was to stay with that moribund dysfunctional colossus that is AT&T. I should have done my homework and switched to one of the new skilled VoIP providers.

I am not using the phone a lot, so at first I did not notice the line had been cut by AT&T for a couple of days. It was only when my roommate noticed that I was no longer getting robocalls (that theater of the absurd where the computer of a solicitor illegally calls the computer of my AT&T digital answering machine and bizarrely tries to sell to it some useless service such as carpet steam cleaning), that I checked if a phone was off the hook and noticed the line was dead.

Indeed, that same day on May 7 AT&T had promptly disconnected my landline, but instead of giving me VoIP, they switched my number to a service they call "AT&T Wireless Home Phone" which is run by their subsidiary Cingular Wireless, as their service people keep calling it. In my house I get zero to one bars on AT&T wireless, so I am not interested in that. Also, they gave me the Uverse equipment for VoIP, not the Wireless Home equipment.

So far, I have made three trips to the AT&T store in Palo Alto and I have been on the phone literally for several days with a number of people in AT&T’s support organizations (they have several and they do not talk to each other: they are dysfunctional). However, except for once for a few hours last Saturday’s morning, AT&T has not been able to restore my phone service.

This is where companies like AT&T are recklessly damaging the American economy. The life task of us scientists and engineers is to invent technologies that make society more efficient. The task of service companies is to deploy these technologies so general wealth is increased and we get to live in a better world.

Dysfunctional companies like AT&T not only prevent us from becoming more efficient: through their dysfunction they prevent us from doing our work and therefore they are a dead weight to society by slowing down its productivity.

AT&T Chairman, Chief Executive Officer and President Randall L. Stephenson

AT&T is a $127 billion conglomerate led by Chairman, Chief Executive Officer and President Randall L. Stephenson. Obviously, he does not know how to run an efficient organization. Maybe the campaign "It Can Wait" for which he is famous refers to his inability to integrate the companies making up his conglomerate.

According to the target compensation table on page 44 of AT&T’s 2014 proxy statement, Mr. Stephenson’s total target compensation is $20,600,000 per annum. Assuming Mr. Stephenson works 48 weeks a year and shows up five days a week, he works 240 days a year. Therefore, he makes over $85,833 a day.

So far, Mr. Stephenson wasted 11 days of my life, so he owes me already $944,163. To be honest, he does not owe this money to me but to my employer, because for 11 days so far at work I could only type with one hand since the other hand holds my phone while I am on calls with his various disconnected support services. In my free time I cannot relax to recharge my batteries to get back to work in good shape. Instead I have to interact with powerless AT&T employees.

I am sure this is not only happening to me but to thousands of AT&T customers. When we tally up the wasted time using Mr. Stephenson’s total target compensation, we get a significat number of the economic damage this causing to our society in terms of dollars.

Could Mr. Stephenson just be an innocent victim of a broken system? No! In January 2000, I spent $4,500 ($6,135 adjusted for inflation) to run an underground conduit from the utility box in the sidewalk to the service entrance in the back of the house. The City of Palo Alto had us put in the pipe because they had run an optical fiber cable in our neighborhood’s street as part of their Fiber to the Home (FTTH) project.

After the first 90 or so houses got hooked up with a 100 mbps Internet connection, the City turned off the light in the FTTH cable. This was because AT&T and Comcast had sued the City on this initiative and the City determined it did not have the financial means to fight out a battle in court. This proves that the AT&T executives are not innocent bystanders. Rather, they are ruthless bullies.

When I commute to work, I do not take the Ford street or the General Motors street and pay them a fee of $300 per month for their service. Rather, the respective governments own and maintain the various road communication systems like the interstates, the county roads, the city roads, etc. We call them freeways and we pay them through various taxes, fees, and tolls.

Today the Internet has the same economic importance as the road transportation system. It is time for the various governments to exercise their eminent domain rights and take the communications infrastructure over from inept private companies unable to provide a dependable service.

In light of the 2000 Watt Society, it would make sense to tax the consumption of electric energy to finance the Internet infrastructure, because of the energy footprint of the digital economy. To pay for the necessary new infrastructure investments, the government can levy installation fees, tolls on expensive usages, etc.

Like in road transportation the government provides the freeways but not the cars or the gasoline, the role of ISPs and content providers can be left open for competition to the many skilled new companies that know how to run communications services efficiently.

For example, my current ISP is AT&T, but they outsource the service to Yahoo!, which could provide me the ISP service directly. Similarly there are many efficient content providers and telecom providers that can do this much much better than the old companies. Examples are Amazon, Apple, Facebook, Google, Hulu, Netflix, Ooma among the most well known ones.

Let us jump ship from the old companies that are no longer able to provide reliable and affordable services. We do not need people making more than $85,000 a day while not delivering. Let them go back into the trenches and splice optical fiber cables.

In the meantime, I am incommunicado, so if you want to reach me, either come to my door or send a carrier pigeon.

Tuesday, May 13, 2014

Commuting to work

For most of my life I have been lucky to work just 3 km from home, so I have not been exposed too much to the commuting woes. For example, when I arrived in the Silicon Valley, the 101 freeway had two lanes in each direction separated by a wide median strip planted with oleanders. Over the years, the median strip has disappeared and 101 became a freeway with four crowded lanes in each direction. For the last two or three years, a fifth auxiliary lane is being added in each direction in the portion between Marsh Road (Facebook) and 85 (Google, LinkedIn, Microsoft), so I have heard a lot of yammer from my coworkers.

For the past year I have been a commuter myself, barreling down 23 km to the San Jose airport every day. Unfortunately there is no usable public transportation, so I am condemned to this daily freeway maltreatment. It starts after 2 km, when I enter 101 on Embarcadero, where about 20% of the drivers illegally cross two double lines at a 90º angle to force themselves in a passing lane before the actual freeway entrance, while pushy Gbusses force themselves from the high occupancy vehicle lane to the exit lane and a few 100 m later a slew of cars try to make a –90º turn from the leftmost lane to the San Antonio Road exit.

During the past year I have tried to develop a driving model that would reduce my stress, but not very successfully. Last Saturday finally was able to see a sophisticated model in action and it was an eye-opener: I got to ride a Google Car from the Googleplex down 101 to the 280 interchange and back.

Sitting behind the "driver" I had a good view of the laptop on the lap of the lady in the front passenger seat, displaying the car's model of the surroundings based on the lidar spinning on top of the car and also a radar in the front of the car, an inertial sensor in the rear wheel axis and last but not least on countless hours of tweaking the model based on the feedback of skilled professional drivers like Anja—our pilot on this trip—who rides full-time for her work.

On the console we see the freeway lanes, our projected route, and the surrounding vehicles. When a vehicle creates a dangerous situation, it is marked with a danger sign. The model recognizes the lights of emergency vehicles and can pull over according to the law. However, it ignores other car's blinkers. In fact, the American driving culture is that the other drivers are your enemies and you do not want to warn them by letting your intentions to be known: the blinker is either never turned on or left blinking.

While as a human I can model a few cars around me, Google's algorithm can model many cars around our self-driving car, in all directions. When our car gets in the blind spot of another car, the icon of that car is flagged with a danger sign. With a surprising frequency, the flagged cars cut us off at a dangerously close distance. Since I am not driving, I can look in the offending cars and can never see those drivers turning their heads to check the clearance. Therefore, they are all driving erratically without looking, resulting in the car being cut off, breaking and propagating this backwards to the following cars.

Like computers can beat humans at chess because they can predict a larger number of steps, Google's car is better than human drivers because it can by far model more vehicles than a human can. Yet, humans are too stupid and reckless for Google's algorithm to be completely foolproof. For example, at one point in Santa Clara we were in the right lane and a big truck tried to pass us driving above the speed limit and on the shoulder. Our pilot Anja recognized, maybe from the truck's exhaust fumes, that he did not have enough torque to pass us and the shoulder turned into a ditch a few meters further ahead. This would have left the truck driver to either go full speed into the ditch or ramming us, so she floored our brakes.

Those reckless drivers are in part professional drivers who spend their working day on the freeway driving trucks, taxis, limos, etc. This indicates that most humans are unfit to drive cars.

But are driver-less cars the answer? When I was a teenager, I thought that by 2014 I could fly to the moon with TWA or PanAm and get to Paris in a couple of hours on a Trans Europ Express (TEE). It would never have crossed my mind that in 2014 I would be driving a car on a freeway full of incompetent erratic drivers.

The mistake being made by the Caltrans agency is to build those auxiliary lanes. Instead, they should have built a train like the S-Bahn on that old median strip. A skilled professional train driver could get me to work in a few minutes, safely and without stress.

Friday, March 21, 2014

3D print selfie

Sony Music Communications Inc. started selling the 3-D Print Figure product last year in which a figure is sculpted using full-color 3-D scanners. To create the figure, the scanner first obtains data through the scanning of a person from head to toe.

Then a computer models the data and outputs images through a 3-D printer using color ink, special bonding materials and white plaster powder. The price for a figure ranges from ¥49,000 to ¥120,000 ($600–$1500), depending on the size. According to Yosuke Takuma, who planned this business for Sony Music Communications, these 3-D figures are popular among people who want to mark such special occasions as weddings and matriculation ceremonies.

Koji Iwabuchi and his wife Yumi visited the studio from Suginami Ward, Tokyo, to order figures to commemorate their 20th wedding anniversary. “It’s like photography at the end of the Edo period as we cannot move at all,” Koji Iwabuchi said. “It’s interesting to feel like Ryoma Sakamoto. In the future, it might become an ordinary thing, but it’s fun that few people have experienced this,” he said. Ryoma Sakamoto (1836-1867) is known as the subject of some famous photos from that time.

Article with pictures

Wednesday, July 10, 2013

Global Innovation Index

For the first time since 2009, the U.S. has been ranked among the top five nations in the Global Innovation Index 2013 (GII). The U.S. placed fifth behind Switzerland, Sweden, the U.K., and the Netherlands, ranked first through fourth, respectively. The annual report, released by the World Intellectual Property Organization, Cornell University, and INSEAD, is a key benchmarking tool for businesses, policy makers, and others concerned with the relative status of nations in the global innovation environment.

The GII relies on two sub-indices, the Innovation Input Sub-Index and the Innovation Output Sub-Index, each built around pillars.

Five input pillars capture elements of the national economy that enable innovative activities: (1) Institutions, (2) Human capital and research, (3) Infrastructure, (4) Market sophistication, and (5) Business sophistication. Two output pillars capture actual evidence of innovation outputs: (6) Knowledge and technology outputs and (7) Creative outputs.

Each pillar is divided into sub-pillars and each sub-pillar is composed of individual indicators (84 in total). Sub-pillar scores are calculated as the weighted average of individual indicators; pillar scores are calculated as the weighted average of sub-pillar scores.

Saturday, April 27, 2013

HB-SIA

HB-SIA

Two weeks ago, Switzerland started its new international tourism campaign, projecting a quaint image invented by Romantic writers like Friedrich Schiller and Johanna Spyri, with a few chaps from the Outback fighting in a Schwingen match. This suits well with the political majority party, who would like to place a cheese cloche over the country so it can live in a bubble.

Meanwhile, the Swiss fret over the 2050 energy package, ratified 25 May 2011, after Fukushima and the decision to exit nuclear energy generation. The slogan is that of the 2000-Watt Society, in which each person does not use more than 2000 W per day (today's average is 6000 W) and emits less than 1 Ton of CO2 per annum.

Such goals require the thought leadership of visionaries and effective demonstrators. Solar Impulse has been one of the best demonstrators. For example, in May 2012 it flew from Payerne across the Mediterranean to Rabat and Quarzazate, convincing the Moroccans that solar energy is the way of the future, supporting the plan by King Mohammed VI to construct the world’s largest thermo-solar power plant in Ouarzazate.

The visionaries behind Solar Impulse are Bertrand Piccard and André Borschberg, along with their sponsors and their big team.

Bertrand Piccard and André Borschberg

The numbers of Solar Impulse are quite impressive: with a wingspan of 63.40 m it is the size of an Airbus A340 or a 747, but it weighs only 1,600 Kg, just a little more than a Prius. Its range is infinite, because it can fly perpetually, since it produces much more electricity than it consumes, just as the Swiss hope to do with their houses.

Currently Solar Impulse is in Hangar 2 at Moffett Federal Airfield at Ames Research Center, getting ready for the next mission.

Admirers of Solar Impulse in Hangar 2

Solar Impulse in Hangar 2

Although the airplane can fly perpetually, in their 2015 flight around the world with the second model, license HB-SIB, Bertrand Piccard and André Borschberg will take turns every 5 days, because that is how long a trained human can stay awake and pilot, and also sit with very limited motion on the pilot seat/toilet combo:

Solar Impulse cockpit

On the first of May, Bertrand Piccard and André Borschberg will take off from Moffett Field at a speed of 44 km/h and fly their Across America mission, which will take them to Phoenix, Dallas, Saint Louis or Atlanta, Washington D.C., and finally JFK in New York City.

If you happen to look up and see a jumbo with license HB-SIA soaring silently at a speed of 70 km/h, think what you can do to give back more energy than you consume, so your total usage (think at those servers farms delivering your contents) is below 2000 W per day. In the case of the Solar Impulse, its 11,628 SunPower solar cells have an efficiency of 23% and drive the four brushless sensorless electric engines in addition of charging the batteries for when there is no sunlight.

Tuesday, May 17, 2011

Advising on color palettes

In the last couple of months I had been writing about the problem of selecting color palettes that are visually pleasing. I started with Mik Lamming's effort in bringing back to the office the colors that were sacrificed with the transition from mimeographs to Xerox copiers and from color-ribbon typewriters to IBM Selectrics. After a digression on the appearance of flamingos, I continued with the problem of selecting colors for VLSI design and illustration, showing the Meta-Palette and a set of other color selection tools.

Today I will step back a little and present a broader view. The problem of designing pleasing or harmonious palettes is as old as visual communication. In western culture a quantum leap occurred with Leonardo da Vinci's prolific work on color analysis and structure (leading to chiaroscuro), which continued with Michel Eugène Chevreul's simultaneous contrast (leading to Impressionism), and with Georges Vantongerloo's attempt to mathematically represent color palettes (leading to De Stijl and Bauhaus).
Essentially the Proto-Palette was just an evolution of this thread, made by a guy sitting in his office and talking to media designers. The fire test came around 1989, when it was decided that GlobalView's desktop would be in color. It turned out that the Proto-Palette tool (color harmony) was too regimented and the Digital Palette tool (palette database and color blending) needed a flexible user interface, so I integrated these tools, along with the earlier Meta-Palette and Maureen Stone's Color Tool.

This integrated set of tools allowed designers to start with a palette—for example, complexion—and add a contrasting color or changing a color lexically by adding a modifier like "muted." Codeveloping the color selection tools with the GlobalView GUI, all while the designers where working on the desktop (icons, etc.) proved to be very fruitful and efficient, leading to a paper at SPSE's 43rd Annual Conference (now IS&T). Since I had a full implementation, I gave a demo at the end of my presentation:

These tools were not the only game in town. At Tektronix, Jerry Murch and Joann Taylor were doing similar work. In Japan, Shigenobu Kobayashi had developed a system based on his Color Image Scale:

Color Image Scale, Shigenobu Kobayashi

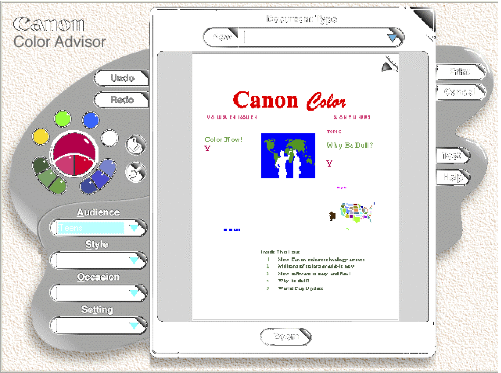
All this came together around 1993 with the release of Canon's Color Advisor, described in L. Lavendel and T. Kohler: The Story of a Color Advisor. In S. Sü̈sstrunk and A. Lakatos, editors, Sixth Color Imaging Conference: Color Science, Systems and Applications, volume 6, pages 228–229, Scottsdale (Arizona), November 1998.

Canon Color Advisor screen dump

As they describe in their paper, Larry Lavendel and Tim Kohler actually surveyed their potential users, instead of just working with a few designers like I did. This allowed them to take into account the semantic aspects and thus create a tool that is easy to use by anybody, as opposed to my tools, which were usable only by designers and researchers.

It is a pity, the Canon Color Advisor did not survive in the market, because nothing better was produced after it and it looks like with their Canon Color Agent, Larry and Tim were up to something even much more powerful.

In retrospect, Canon's Color Advisor was just too far ahead of time. When in 1991 Canon implemented their device independent color management system, they tried hard to fully integrate it into Windows. When Microsoft refused to cooperate, Canon's CEO Dr. Yamaji flew to Seattle to negotiate directly with Bill Gates.

Unfortunately the latter declared that Windows users will never create color documents, and all that was needed in Windows was a fixed palette of 16 colors for the GUI, with none required for documents. When Dr. Yamaji insisted, Gates declared that color would require an additional floppy disk in the upcoming release of Windows 3.1, and at 15 million copies to be sold, the cost for enabling managed color documents would be the astronomical sum of $15 millions.

Unfortunately this forced Canon to bury its Color Advisor in the printer driver for a post-processing step, instead of making it available during document creation. However, it did save Microsoft $15 millions, and I am sure they made good use of it.

All this is old history. The notion of artists, designers, and scientists designing color palette selection tools is a concept of the second millennium. In this millennium, the process consists in crowd-sourcing large data corpora and using analytics to make inferences. The questions then are:

  1. Is crowd-sourced data reliable?
  2. Do the methods scale?
  3. When do we get a modern color advisor?

Wednesday, February 23, 2011

Mik Lamming's Digital Darkroom

In the mid-eighties the world of electronic imaging was still rarified. Researchers were pushing the state of the art on very expensive computers and vying to get their papers into SIGGRAPH. Some years earlier, IBM's monochrome Selectric typewriter and the monochrome Xerox copier had banned color from the office, with the demise of color ribbons (black and red, sometimes blue too) and multicolor mimeographs.

Sunday, November 21, 2010

Mail Chutes and Optimal Team Size

Interesting Business Insider article on innovation.


The article starts with the assertion that Google can’t keep its teams small enough. This is then followed by the story of:

'how Larry Ellison actually got efficiencies from teams. If a team wasn’t productive, he’d come every couple of weeks and say “let me help you out.” What did he do? He took away another person until the team started shipping and stopped having unproductive meetings.'