Wednesday, December 24, 2008

Gunther Receives A.A. Michelson Award

At the annual CMG International Conference in Las Vegas last week, Dr. Neil Gunther was the recipient of the prestigious A.A. Michelson Award; the industry's highest honor for computer performance analysis and capacity planning. As he said in his acceptance speech, it was the fulfillment of a dream he had entertained at his first CMG Conference in 1993.

His presentation was unusual in that, rather than reviewing his own accomplishments, he presented a personal view of the experimental physicist Albert A. Michelson (after whom the award is named), his famous null measurement of the luminiferous aether, and its significance for both physics and computer management today; particularly in the context of the search for the Higgs boson at the LHC. As a theoretical physicist, Gunther holds the view that the Higgs will probably not be observed, many false positives notwithstanding. Like the aether search, it may well end up as the next famous null experiment.

Link to the announcement in Linux Magazin: click here.

Monday, December 22, 2008

Transitioning colors: glaucus

In Switzerland, when I was a pupil in elementary school, at the beginning of the school year we used to receive a small box of colored pencils in the main colors. The first years of school were spent learning the names and semiotics of those colors, as well as depicting our environment.

It was only later in elementary school that I learned a new color name, namely glauco. It was in a poem from our textbook, that we had to memorize.

The Zanichelli vocabulary translates glauco into English as blue-green, sea-green, glaucous. I guess the readers of this blog will be familiar with this color name from glaucoma, a condition of increased pressure within the eyeball, causing gradual loss of sight.

Today in Italian, glauco is associated most commonly with eye colors, because of the gray-green haze in the pupil.

Why am I counting this color among the transitioning colors? Over time, this color label is one that has changed quite dramatically in its association with a perceived color.

It starts with eye colors. My Sanesi classical Greek vocabulary from high school lists the following classical terms, in alphabetic order (apologies for the missing accents):

  • γλαυκιαω, to have an inflamed look
  • γλαυκ-ομματος, with inflamed eye
  • γλαυκος, scintillating, brilliant, shining || cerulean, azure
  • Γλαυκος, name of many characters
  • γλαυκοςτης, luster, shine of the eyes || cerulean color
  • γλαυκο-χρως, of azure color, of olive and pale color
  • γλαυκ-ωπις, of the shining, brilliant, cerulean eyes

In summary the classical use was for the shining color of eyes, mostly light blue, for example the color of Athene's eyes (glaukopsis). However, in the Homeric epics it has been used also for dark blue. Strangely, γλαυκο-χρως has been used also for olive and pale colors.

This strange use might at first explain why then in the later Middle Ages the meaning of the derived Latin term glaucus changed dramatically from blue-gray to yellow. Instead, I would like to speculate here that it might be connected to the loss of diphthongs as Latin became vulgarized.

In my Campagnini-Carboni classic Latin vocabulary from middle school I find these two definitions:

  • cærúleus, cerulean, azure, turquoise, dark; cærula cæli, or simply cærula, the azure, the azure sky
  • cerula, piece of wax

As you see, as the diphthongs were dropped with the vulgarization of Latin, cerulean blue might have become the color of wax. Indeed, Roger Bacon (~1214-1292) used glaucitas to refer to yellowness and ceruleus (wax color) as a yellow color falling between glaucus and citrinus (yellow and orange, respectively).

In the 14th century, Theodoric of Freiburg used glaucus with the same meaning. But then, in the mid-16th century, Scaliger (1557) put it back in the blue category, where it still was in the beginning of the 17th century with Francois d'Aguilon. (This data from Kuehni and Schwarz, Color Ordered, p. 8.)

If the label purple changed as a consequence of the collapse of a major civilization, the label glaucus might have been done in by an overworked or sloppy monk. In this case, γλαυκο-χρως used for olive and pale colors can be a medieval mistake rather than a genuine classical Greek color label.

Make sure, you dot your is and cross your ts, and watch out for those pesky diphthongs!

Wednesday, December 17, 2008

さきみだれる = blue light + cryptochrome 2

We scientists have a special way to ruin a poetic or romantic moment. For example, we might be sitting in front of the most powerful sunset, and all that we can think of is Rayleigh scattering and how what we see is just the effect of the fourth power on the frequency factor.

And now another natural phenomenon might be ruined: 咲き乱れる (さきみだれる), for which we do not even have a proper translation — it took a Japanese haiku master to come up with such a concept.

Here is how the editors of Science summarize the paper by Liu et al. from the department of Molecular, Cell, and Developmental Biology, University of California, Los Angeles:

Plants respond to light with a variety of developmental and physiological changes. The receptor for the blue-light wavelengths is cryptochrome. How blue light causes cryptochrome to alter cellular function has been a puzzle. Now, using a yeast two-hybrid screen, Liu et al. have identified a protein from Arabidopsis, CIB1, which, in the presence of blue light, interacts with the cryptochrome. CIB1 and cryptochrome colocalize in the plant cell nucleus, where CIB1 functions as a transcription factor. Together, these proteins bring the input of blue light into the signaling pathways that regulate flowering.

By the way, this cryptochrome mechanism is one of these tricks Nature is using over and over, in us humans too. CIB1, which is short for cryptochrome-interacting basic-helix-loop-helix, appears to affect primarily the amplitude, but not the period, of the circadian rhythm of the FT mRNA expression. Therefore, next time you complain about jet-lag, think the same mechanism also controls floral initiation and more poetically, 咲き乱れる.

Now, if we could only remember how to let a thousand flowers bloom in research labs!

Click this link to access the paper: Photoexcited CRY2 Interacts with CIB1 to Regulate Transcription and Floral Initiation in Arabidopsis.

Wednesday, December 10, 2008

Transitioning colors: purple

In my post on the ephemerality of color names I wrote that color names can go out of fashion and then the label of a given color is lost. It also happens that a label is persistent, but the color associated with that name changes. Purple is such an example.

Nathan's color thesaurus responds to "porpora" with the color of hexadecimal value b23372, which looks like


However, if we look at this old mosaic in San Vitale in Ravenna, we see a different color for the same label "porpora":

What happened?

From Phoenician times the purple colorant was extracted from molluscs living in the coast of present day Lebanon and Israel. It was a rare colorant, hence used only for textiles destined to the rich and powerful. In fact, in 1464 Pope Paul II decreed that cardinals have to wear purple.

By coincidence this was the time the Byzantine empire crumbled and in the Ottoman empire the Purple industry in the Eastern Mediterranean disappeared. Hence, the tailors had to switch to a red colorant, but the papal decree cast the label "purple" into concrete.

If today you visit a religious clothing store, when you ask for Purple you will get a red cape, as shown below. In this case, Italian crowdsourcing returns Purple more to the original color, but not quite.

This is a big problem for restorers. As you might have seen in the Sixtine Chapel or Leonardo's Last Supper, today's restorers are very aggressive in restoring the original colors, instead of just freshening up the old paint in its current state.

One way to figure out the original colors is to study the master's notebooks and find textual descriptions of the colors. Unfortunately, for a given label, the colors transition, especially today when all paints care constantly reformulated to make them less toxic.

Anyway, these color transitions is exactly why Prof. Giovanni Brini in Torino has compiled his comprehensive color name dictionary. It is intended for restorers who have to pin-point the color for a given name at a given date.

Tuesday, December 9, 2008

A wimp's 40th birthday

Industry analysts generally equate modern personal computing with the GUI, or graphical user interface. Therefore, March 1992 is generally seen as the birth of the PC, namely the release date of Windows 3.1.

There is then another group of analysts that then counters the GUI was really invented on 24 January 1984 when the Macintosh was released. Of course others then claim the GUI is older than that when Smalltalk with its WIMP paradigm was invented at Xerox PARC.

Actually, the WIMP paradigm is even older than PARC. The PC was really invented concomitantly with the mainframe, and the main person behind it was "Lick" Licklider. You can read up the PC's history in M. Mitchell Waldrop's "The Dream Machine."

Anyway, the acronym is WIMP, which stands for windows, icons, mice, and pointing. That goes back to 40 years ago.

It the PC's history was linear, today we would use them to solve partial differential equations. The basic idea was time sharing, later called adaptive computing and today called cloud computing. Not a reason to spend money on an iPhone, Blackberry, or Netbook.

The paradigm shift occurred in San Francisco on 9 December 1968 at 1 p.m. at the ACM conference, when Doug Engelbart demonstrated his On-Line System or NLS. It was about augmenting human intellect, and in a single demo (a.k.a. The Mother of All Demos) he introduced concepts like windows, hypertext, mice, cording keyboard, collaborative software (groupware), video chatting, networking, and more to a stunned crowd still using punched cards.

The celebrations are this afternoon at Stanford in the Memorial Auditorium.

Happy Birthday, WIMP!

The ephemerality of names

From the paper mentioned in my post of 2 December we know that color categorization is probably mediated by language, which is what is meant by the statement "a form of categorical perception that is lexically influenced." The next problem is how to deal with the ephemerality of language.

Languages are in constant evolution (well, maybe with the exception on French, where bytes are still called octets). For example, in Japanese the katakana script that was originally used for bureaucratic and male writing, has been repurposed to write words of foreign origin — and how many foreign words there are! Look at something as common as milk, which used to be 牛乳 (ぎゅうにゅう, gyuunyuu) but now is simply ミルク (miruku).

Closer to home, consider late ETH Prof. Heinrich Zollinger's work ca. 1975, where he collected color names from TKD chemistry students:

The ordinate is the frequency of occurrence for the name of the Munsell hue in the abscissa. Note how オレンジ (orenji) is more frequent than 橙 (ダイダイ, daidai) and ピンク (pinku) is more frequent than 桃色 (ももいろ, momoiro).

Maybe the change of the Japanese language is a bit extreme, but English is also changing fast, especially for words related to fashion, like color names. Look for example at the names in Coloroid hue 20 I showed last week:

Did you know the color name Arsigont? Did you know the difference between Pompeian yellow and Indian orange?

This is not a problem of the Coloroid system. Consult any color name compilation older than a few years, and you will find names that look unfamiliar. For example, a decade ago teal was all the rage in Palo Alto and all home decoration stores were selling many items in this color. Today, people hardly remember its appearance.

So, how do we deal with the ephemerality of language? Obviously a printed leather-bound collector's edition of a color dictionary is not the ticket. The ephemerality of a blog tool post is more like it. But color names are very hard to collect, we cannot start from scratch every few months.

This is why in the Italian version of his color thesaurus, Nathan included a mechanism to rate the pairing of the color name with the displayed color. As names fade, they get rated worse and by using the rating in the creation of the thesaurus, a more contemporary color name will emerge to label that color.

Saturday, December 6, 2008

Colored geese

When I did my first steps in image processing, researching new algorithms was not for the faint of heart. First you had to be a maestro programmer (a.k.a. wizard) because to get the algorithm to run with a usable performance on a sub MHz processor with 64K bytes of memory you had to write a paging algorithm to fit it all in memory and code the inner loops in octal code so not to miss any clock cycles and work directly on the barrel shifter. You also had to stick an exception handler at the beginning of the boot loader to catch processor faults and get a chance at debugging your algorithm.

A first quantum leap happened when Photoshop came out, because you could first try out things interactively, then you could write a plug-in with your algorithm.

The next quantum leap happened with MatLab, which contains well programmed image processing libraries that allow you to quickly implement your algorithm expressing it as a linear algebra problem.

A new quantum leap is happening now with Mathematica, which now allows images as parameters, contains an image processing library, and gives you the full power of symbolic computing. Read more about it in this blog post by Theodore Gray. [Click the image to view the movie.]

Colored geese--click to view movie

Many thanks to Don O'Shea for the pointer.

Tuesday, December 2, 2008

Categorical color perception moves from right to left hemisphere across life span

It feels a very long time ago when in 2003 I was assigned to solve a problem in variable data printing — when colored text is printed on a colored background and the colors are variable, the text may become unreadable. Since each copy is different in a variable data job, manual proofing is not feasible and an algorithm is required.

Conventional colorimetry is of no use, because it deals with color matching — small color differences — not the large color differences to be considered in readability issues. Required to quickly deliver some code, I came up with a heuristic based on ∆E units. Silvia Zuffi and Carla Brambilla of the CNR in Milano-Bicocca have revisited that work and performed genuine research replacing my heuristics.

Once the code was delivered, I implemented a different algorithm more suited to the task. As the research by Zuffi and Brambilla shows, the readability problem can be formulated as a reading speed problem. From Stevan Harnad's work we know that color discrimination is faster for colors in different perceptual color categories than for colors in the same perceptual categories, when their perceptual distance (∆E) is fixed.

The most obvious way to introduce structure in a color space, i.e., to introduce perceptual color categories, is by considering color names. The new problem now is to find a 3-dimensional tiling of a color space. I had the data for Nemcsics's names in the Coloroid system, so I implemented that.

The implementation of the readability solution was then straightforward. I used the lexical distance between the two colors and required at least 2, i.e., there had to be at least a color name between the two color's names.

The solution performed only so-so. In fact, there were a number of issues.

  1. The transformation from CIE tristimulus is only published in part and required a lot of experimentation to pin down
  2. This transformation is numerically instable, so an industrial-strength implementation that never fails is not trivial and requires skilled programing
  3. The tiling does not cover the whole gamut, so it needs to be "stretched"
  4. There is no reference in the literature on the origin of the categories and names — did Nemcsics cook them up heuristically?

But the biggest question is: are the color categories mediated by language? Is it legimimate to use color names for a lexical metric? Each time I put up my old color cognition diagram

co-blogger Nathan Moroney always interjects that color categorization may occur much earlier. The paper Categorical perception of color is lateralized to the right hemisphere in infants, but to the left hemisphere in adults in a recent issue of the Proceedings of the National Academy of Sciences comes very close to answer this question.

Franklin et al. take advantage of the difference between the left and the right hemisphere of our brains (let us assume for a moment we are all right-handed and have a normal corpus callosum) that the left hemisphere is geared to encoding categorical or relational information, while the right hemisphere is geared towards encoding metric information.

The linguistic hypothesis in color categorization is that colors are tagged by their category name and the tags are compared, i.e., that language mediates categorical color perception. The question is whether the color categorization is prelinguistic, i.e., whether there is a universally available color categorization and language just makes some minor adjustments, or color categorization is built from scratch after language is available.

Franklin et al. used a group of 21 years old right-handed adults and a group of 21 week old infants and compared their categorical color perception skills, obtaining these results:

(remember the neural axons get crossed in the optical chiasm). Categorical color perception is found in infants; however, the absence of a category effect in the left hemisphere for infants, but the presence of a greater left hemisphere than right hemisphere category effect for adults, suggests that language-driven categorical perception in adults may not build on prelinguistic categorical perception, but that language instead imposes its categories on a left hemisphere that is not categorically prepartitioned.

Their findings therefore suggests that there is a form of categorical perception that is nonlinguistic and right hemisphere based (found in infancy) and a form of categorical perception that is lexically influenced and biased to the left hemisphere (found in adulthood). Categorical color perception is found for both infants and adults, but the contribution of the left hemisphere and right hemisphere to categorical color perception appears to change across our life span.

Our digital presses are for adults, so my approach is valid.

Thursday, November 27, 2008

Recycling slideware

In my years at HP I have produced a very large corpus of slideware. The sad part of this is that unlike papers, slides are ephemeral artifacts discarded after a single use. I write sad, because a lot of effort goes into the production of a slide deck, especially in industry, where there are strict design rules and everything has to be "high-concept".

In the past I was posting my formal external presentations in my publications web page, as a link in each conference paper reference. This was useful for people finding my publications using a search engine, but now people use more specialized search tools and then find my publications in the digital libraries of various learned societies in whose conferences the work was presented. These digital libraries do not contain slides because they are informal.

There is a service that allows you to recycle your slides. It is called slideshare and allows you to upload your slides for conversion in to Flash objects that can be embedded. Probably the most logical place to embed your slides is your LinkedIn profile, were people in your social network can discover them, download them, and reuse them.

You can also embed the slides in your blog, like here a presentation I gave in September:

As you can see, you can quickly browse the slide deck right here in the blog. If you want to reuse some or all of it, you can click on the title above the slide. This takes you to the slideshare page, from where you can download the presentation.

As you may note, some functionality gets lost in the conversion from PDF to Flash, like the navigation labels in the slide headers. However this is a minor detail. Because the slides are on slideshare's site, you can embed as many slide decks as you want in a post, without burdening your blog platform.

For example, here is my trusty old slide deck on Understanding Color:

Understanding Color
View SlideShare presentation or Upload your own. (tags: color_science short_course)

As you see here, the QuickTime movies are not embedded, but the link on the slides is more convenient anyway, because you can prepare the movies in QuickTime players and show them from there.

Of course, a simple slide deck like this one on MPEG-21 carries over as is:

Introduction to MPEG21
View SlideShare presentation or Upload your own. (tags: mpeg mpeg21)

By the way, each of these slide decks was produced with a different authoring tool. The color cognition deck was produced using the fancy Beamer document class in LaTeX, the introduction to color in the antiquated but robust FrameMaker document preparation system, and the MPEG-21 deck was written in PowerPoint.

Monday, November 24, 2008

The future of electronic paper

The Web site "The Future of Things" has an interesting page on the future of electronic paper. It has interviews with Nick Sheridon of Xerox PARC resp. Gyricon and Till Moor from Siemens. Many photographs show prototypes developed in the laboratories of various companies active in this field. The link is http://thefutureofthings.com/articles/1000/the-future-of-electronic-paper.html.

Wednesday, November 19, 2008

Pigeons missing in action

It used to be that when traveling you had to bring to your hosts presents from your place of origin. This custom is known in many cultures and words like souvernir or おみやげ (omiyage) have been absorbed in many other languages.

Today this is no longer meaningful, because the concept of exotic has disappeared. This is due to the science of logistics, which has made the transportation of goods so efficient that now you can buy everything everywhere and at the same price.

Despite the miracles of modern logistics, it has a point of failure: the operators follow the instructions of computers, and even if goods are tracked at every step, they can disappear when an unanticipated event occurs.

For example, on September 17 I gave a presentation on color cognition and promised to send a printed copy of Nathan Moroney's color thesaurus and the presentation handout for the asking. When I returned home, I ordered the prints from MagCloud and mailed them to the interested parties.

Unfortunately, the envelopes never arrived. Because the recipients where in different countries, I can be certain that the snafu must have happened before the mail was sorted, i.e., between the mail stop near my cubicle and the United States Postal Service Processing and Distribution Center in San Francisco.

I did stamp the envelopes as air mail. Maybe a confused logistics operator strapped the envelopes on carrier pigeons… Were the carrier pigeon then hijacked in the San Francisco Bay and kidnapped to Eyl?

In fact, most of the time logistics operators do not know what they are doing. They are just trained to blindly and efficiently follow the procedures dictated by the logistics computer. This is one of the tenets of the anorexic company — there are no provisions for the unanticipated or even for incertitude. Immediate action must be taken, regardless of whether it makes sense.

Maybe two countries are a little better off: Japan and Switzerland, where workers are expected to always use their brains when they work (possibly with an exception here in Martigny, where many a brain has become yogurt from boozing Fendant). This is achieved through the concept of the apprenticeship, where future workers are employed as trainees in their future profession while also attending vocational school to develop a theoretical understanding of their chosen profession.

At the Federal Institute of Technology in Lausanne (EPFL) the DUAL-T project in the field of computer-supported collaborative learning has recently delivered to the Centre Professionel du Nord Vaudois (CPNV) this system to train logistics apprentices:

Some smart young people indeed! Should I have carried the envelopes to Martigny and mailed them from here? Not necessarily, because the logistics at SFO or LAX could have lost my suitcases there.

So, if you come across some lost carrier pigeons with a color thesaurus, please energize them and send them along their way…

Tuesday, November 18, 2008

Social Signal Processing

From Eats Shoots & Leaves by Lynne Tuss we know the importance of punctuation and that occasionally it can be a matter of life and death. However, in some cases punctuation cannot come to our rescue.

Such is the case for social signal processing or SSP. We all know what signal processing is, namely the analysis, interpretation, and manipulation of signals. (Incidentally, in our case the signals of interest are color images.) So is social signal processing a European form of socialized processing of images, like social medicine?

In social signal processing the adjective is not social but social signal — it is about the processing of social signals. What makes this confusing is that many of the researchers in this area are signal processing experts. In view of this, the alternate name of social signals understanding is maybe more appropriate.

SSP is concerned with the machine analysis of social behavior. It is a branch of interactive multimodal information management and studies non-verbal behavioral cues and social behavior. Recently SSPNET, a new Network of Excellence funded under work programme topic ICT-2007.2.2 of the European Commission's Seventh Framework Programme, has been funded.

Just imagine yourself one day sitting in front of a financial advisor to talk about your retirement savings and consulting an application on your smart-phone that can assess if you are talking to a snake in a suit

Wednesday, October 29, 2008

Publishing in the cloud

In research the old principle of publishing or perishing has long been replaced by the more quantitative performance metric of publishing in journals with a high impact factor. For example, in the case of the last paper on which I am a coauthor (today papers rarely have a single author, you could not keep up with ranking and funding if you would do that), we did not look which journal is the best fit for our paper.

Instead, we compiled a list of journals that would potentially publish our paper given its subject matter and the importance of its contribution to the advancement of science. Then we sorted the list by impact factor and submitted the manuscript to the New Journal of Physics, with impact factor 3.264. We are obviously very objective and our manuscript will go through a second round after revision, so we picked the correct journal.

Being at the end of my tour of duty as associate editor for a journal with impact factor 0.757, I am very aware of the current bad trend of shopping one's manuscript. In this trend a manuscript is submitted to a top tier journal like Nature (28.751) or Science (26.372) and then submitted again and again to journals with lower impact factor until it is no longer rejected.

Not only does this tax the system by requiring many unnecessary reviews (handling a rejected paper costs about $500, which are not offset by page charges and download fees), but it backfires when a reviewer gets the same manuscript though a different journal. In fact, a good associate editor will seek reviewers that are most familiar with the research described in the paper, so two different associate editors from two different journals will draw on the same small set of potential reviewers. The manuscript then gets rejected as a resubmission of an old manuscript.

It is important to understand that the impact factor is a relative quantity. For example, the Cancer Journal for Clinicians has an impact factor of 69.026, but this does not mean that at 0.757 my journal sucks. On the contrary, compared to other journals in the field it performs quite well. For example its sister journal from the same publisher has an impact factor of 0.455 and that of an other society comes out at 0.220. These journals tend not to publish many survey papers, which inflate the impact factor.

Message 1: use the impact factor with a grain of salt.

As my wife says, even if you win the rat race, you are still just a rat. In reality, today you do not need an impact factor to make an impact. While we can dream of publishing in Science and winning the Nobel Prize (or the Judd Award for us color scientists), today we can shower our incremental knowledge onto humanity with publishing media like personal web sites and blogs. You are reading this post, proving it works!

Granted, it is very informal, but there are some easy steps up. The traditional better medium is the technical report, which can be freely downloaded from the institution's web site, like HPL-2008-109 in the case of my most recent collaboration with co-blogger Nathan Moroney.

For those who want to publish something more glossy, HP Labs is incubating MagCloud, which will satisfy all your vanity requirements. From this link your can order the same technical report, but this time printed on heavy glossy stock and laid out nicely in InDesign instead of LaTeX.

There is even a cloud service to publish the slides of your public presentations. For example, we wrote the above report in the Beamer class, which lays out the same content in a format suitable for overhead projectors (called beamers in German). You can then make available your slides on Slide Share, or even embed them in your blog, like so: http://www.slideshare.net/berettag/cognitive-aspects-of-color-presentation

Finally, since in these difficult economic times everybody is jumping on LinkedIn, you can use a LinkedIn application to post your slides directly on your profile page.

Message 2: use informal media to give impact to your research.

Monday, October 20, 2008

Pushing needles

In my last post Now you see it, now you don't, I passed on the editor's summary of an experiment to research how the brain can combine different views of an object into a single object representation. The researchers inserted needles in the inferior temporal cortex of two monkeys and recorded neurons while the monkeys saccaded to an extra-foveal symbol while the symbol was changed during the saccade.

Reading it like that, pushing needles into the cortex sounds pretty scary, but in reality it is not. Thirty years ago a friend of mine was working for his postdoc with a troglodyte to find the pathway from the visual cortex to the arm's motoric control when a banana was presented. The troglodyte was not in discomfort and actually happily outlived Dr. Gisin, who died at a young age from a brain tumor.

Although Dr. Gisin's team developed a relation with their subject, the problem with such experiments is that we cannot really know what the monkey is thinking. At that time, it would not have been ethically possible to use humans for the experiments. However, in the 30 years since, the medical technology has progressed so much that needles are used clinically to excite neurons in patients with acute forms of diseases like Parkinson's and epilepsy.

Compared to exciting neurons, just recording from them is a minor invasion. Thus data from experiments piggy-backing on clinical procedures are starting to become available. The quantum leap with human subjects is that they can describe what they are thinking.

In Internally Generated Reactivation of Single Neurons in Human Hippocampus During Free Recall, published in Science 3 October 2008: Vol. 322. no. 5898, pp. 96 - 101, a team from UCLA and the Weizman Institute report on recordings from epileptic patients during clinical procedures. In short, they were able to determine that in the hippocampus the neurons are reactivated in the same pattern when a person sees a scene and when the person recalls the scene.

Thus, when we reason on the model of what is happening in the world outside our body, we are in the same state as when we actively scan and analyze the outside world. We cannot immediately discriminate between what we see and what we recall. This is the basis for such effects as memory color.

This is why in general, preferred color reproduction yields more pleasing images than colorimetric color reproduction. And this is also one of the things that makes color science such a challenging discipline.

Here is the Science editor's summary of the report:

The neural correlates of remembering can only be studied with complete confidence in humans, because the subjects can verbally report their internal experience. Brain surgery in which therapeutic electrodes are implanted in the brain of patients with intractable epilepsy provides an opportunity for doing such studies. Gelbard-Sagiv et al. report that neurons in and near the hippocampus of these patients showed specific patterns of activation for each episode of the television show The Simpsons. Later, when these same episodes were brought to mind by free recollection, the same pattern of neural activity was seen, demonstrating that, at least in the hippocampus, recall of a stimulus is accompanied by activation of the same neurons that were activated during the initial experience.

Thursday, October 16, 2008

Now you see it, now you don't

Each object can cast many different images on the eye. How can the brain combine different views of an object into a single object representation? Neurons at the inferior temporal cortex (brain area IT), the top processing level of the visual system, signal the presence of individual objects even if those objects appear in different positions.

Nuo Li and James J. DiCarlo in a report in Science Vol. 321, pp.1502-1507 recorded neuronal responses in area IT of two monkeys to different objects presented at the central position and 3 degrees above or below. By systematically swapping object identity between two objects whenever the monkey made a fast eye movement (saccade) to one particular position in the visual field, the response of the IT neuron became less selective to the objects at the swap position or even inverted its selectivity. Thus, object representations in area IT can change in a short period of time.

Wednesday, October 15, 2008

Have scanner, will travel

Recently, our reader Dan B. from Google sent a link to an article about Prof. Kent A. Kiehl he read in Science magazine Vol. 321 pp. 1284-1286 (also available here). Prof. Kiehl did his graduate work with Prof. Robert Hare at the University of British Columbia in Vancouver, whom you know from his book Snakes in Suits I reviewed over a year ago.

Actually, in that post I displayed this image, which is from Prof. Kiehl's work.

Limbic abnormalities in affective processing by criminal psychopaths as revealed by functional magnetic resonance imaging

In that post I wrote jokingly that we color scientists have an advantage over the general population because in case of a suspicious colleague we could use a modified version of the color naming experiment to unmask them, or we could walk down the hall to a colleague with an fMRI machine and collaborate on an experiment.

The Science magazine article describes how Prof. Kiehl is actually doing just that. With a custom-built mobile functional magnetic resonance imaging (fMRI) scanner — roughly $2.3 million of equipment packed into a 15-meter-long trailer — and permission from the New Mexico governor to work in all 12 state prisons, Kiehl aims to scan 1000 inmates a year.

Kiehl's research is funded by four R01 grants from the National Institutes of Health, which pay about $900,000 a year in direct costs; the Mind Research Network (MRN) at the University of New Mexico in Albuquerque paid for the scanner.

The reason for recruiting the subjects in the state prisons is that these are places where it is easy to find them. However, if Prof. Kiehl would start his research project today, he might have chosen a different venue and population. In fact, In Snakes in Suits Prof. Hare and Dr. Bobiak describe in detail the evolution to the transitioning organization and present the concept of entrepreneurial pretenders.

The book cited several instances of such entrepreneurial pretenders in the saving & loans crisis and Enron. If one follows the news, one might suspect Manhattan is a biotope where Prof. Kiehl might find an abundance of subjects to study.

Speaking about the news from Manhattan, in an earlier post I blogged about how the end of communism and the cold war made the concept of outbraining the communists obsolete and started the demise of scientific think tanks. If one believes the news, one might think we are currently witnessing the end of capitalism, with the widespread nationalization of financial institutions.

This might bring a new era where it is no longer about being number one, but just about working and making a contribution to society. And this might not require think tanks, in the view of our leaders. In fact, the latest issue of Science magazine has a news item by Laura Margottini on Italy Restricts Academic Hires, in which it is reported that academic hiring is being severely cut back and institutions should look for private sponsors. Apparently it will not be the western hemisphere who will dig world economics out of the current hole with new science and technology. We will have to look elsewhere.

Tuesday, September 30, 2008

Experiments supporting the concept of a g(2)-camera

Last weekend, as like an astronaut in a Mercury capsule I sat strapped in a small seat in a metal tube being flung across the Atlantic and Canada's Northern Territories, I was reading the day's press from both sides of the Atlantic to catch up with the last two weeks of news and get an appreciation of the reality field's distortions.

On both sides of the Atlantic, physicists made first page news, but for very different reasons, as you would expect in a Riemannian reality field. In the US newspaper, a journalist had been chasing so-called financial geniuses in New York and London to get the rap on $700 billion of toxic financial papers. In the European newspapers the story was on page four, with the question of why the US Government was talking about $700 billion when the actual amount of toxic paper was $3,500 billion, or $3,500,000,000,000.00.

Anyway, that is what you get with reality distortion, but it was not what caught my attention. The journalists were not able to get any financial genius to speak on the record, so they reported remarks from both sides of the Atlantic stating that the financial instruments were so complex that there was no way they (the geniuses) could understand them, that is why they hired quantum mechanics physicists to cook up risk models.

So, there it was written black on white: the quantum mechanics physicists are to blame for the $3,500 billion toxic papers. Hmm, and I thought the only toxic paper quantum physicists handle is that in the litter box of Schrödinger's cat. And they can even not known if the cat is dead or alive.

The story about the quantum physicists would have been more believable, if they had written the $3,500 billion disappeared in a black hole when the Large Hadron Collider (LHC) was turned on in Geneva (see this article on page 1291 of Science magazine of 5 September 2008).

Science 5 September 2008: Vol. 321. no. 5894, p. 1291

That is what I read in the US newspapers. In the European newspapers physicists made the first page for completely different reasons. The first reason was the LHC. There had been some apprehension about black holes, but the operation start on 10 September was a full success. Unfortunately, over a week later, a possible faulty electrical connection between two of the accelerator’s magnets caused a large helium leak into sector 3-4, moving the start of the experiments to March 2009.

What the newspapers explained in some detail, was how beneficial the $8 billions spent on the LHC was for European industry, because it spurred a large amount of new technology in fields like superconductors and low-temperature materials. While I was reading this, I thought, wow, $8 << $3,500 billion. We could have had our own supercollider in Texas for only the bonuses of one bank in one year!?

The second front page news related to physics in European newspapers was Zhai Zhigang's space walk and the impact the development of the Shenzhou 7 capsule and its launching technology had on Chinese industry, leading it to develop more advanced technologies.

As a whole, from a European perspective, quantum physics and rocket science are not as bad as it is believed to be on this side of the Atlantic. From an international point of view, that had already been decided in the Nüremberg trials, which lets me continue with the meat of this post without shame.

It did not make the newspapers, but last week our paper on experiments supporting the concept of a g(2)-camera was published. If your institution does not subscribe to SPIE's Digital Library, you can buy it for only $18.00 (those are plain dollars, not billions).

Recent experiments have reported the Bose-Einstein condensation (BEC) phase transition for exciton-polariton systems in a semiconductor microcavity. The macroscopic quantum degeneracy is typically detected by probing the statistical properties of light emitted from a microcavity, under the presumption that the statistics of the exciton polaritons are faithfully transferred to the emanating photons.

The macroscopic quantum degeneracy can be established by measuring the correlations viz., first-order in the electric fields:

g1

and seconds-order in the electric fields:

g2

Moreover, it has been assumed that observation of the interference fringes similar to those in Michelson or Young interferometers is sufficient to establish the fact of macroscopic coherence in exciton-polariton systems. Two points on the wave front separated by a distance x12 produce an intensity pattern

intensity pattern

such that the fringe visibility measures the magnitude of the first-order correlation function g(1)(x12, τ). But simply measuring this quantity alone is ambiguous because a coherent light source (e.g., a photon laser or decaying polariton BEC) can exhibit the same first-order correlations as a chaotic (or thermal) light source (e.g. Hg-Ar discharge lamp). The table below shows that proper disambiguation of a coherent state also requires measurement of the second-order correlation function

second-order correlation function

associated with intensity noise correlations. Here, I1,2(t) is the light intensity at a point ±½ x12 and time t.

Maximal values of respective correlation functions for incoherent, coherent and thermal light states

correlation function

photon states

incoherent

coherent

chaotic

g(1)(x, 0)

0

1

1

g(2)(x, 0)

1

1

2

∆g(2)(x, 0)

0

0

1

The minimal condition to confirm the BEC phase transition in a polariton system then becomes

minimal condition to confirm BEC

Our imager detects the spatial correlation excess shown as ∆g(2) ≡ g(2)(x, 0) – 1 in the third row of the table above.

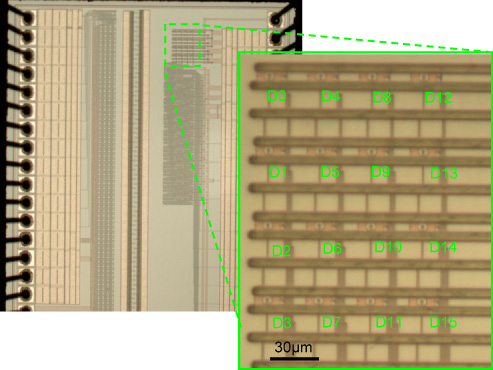
In our paper, we present a novel g(2)-imager built with conventional CMOS technology, which is capable of measuring second-order spatio-temporal correlated photons and thereby offers an important means for verifying the existence of a BEC state of cavity exciton polaritons.

Exploded micrograph of the 4x4 SPAD array

One potential limitation when imaging BECs with our device is the requirement that ∆g(2) = 0, which corresponds to a null measurement. For BEC detection, however, we anticipate that a more practical device could combine conventional g(1)-imaging with g(2)-imaging, either as the same camera operated in two distinct modes or as two distinct cameras working together.

Future work will include the development of larger arrays of SPADs, the integration of on-chip data processing based on equation

and the extension to other g(2)-imaging applications.

A surprising feature of the g(2)-camera is that the parallelism of the sensor stemming from using N detectors does not scale linearly but binomially. For example with a 4 x 4 SPAD array all 16 detectors have separate parallel outputs so that (162) = 120 simultaneous pairwise measurements are possible.

You can get the full paper from this link: http://spie.org/x648.xml?product_id=795166.

Wednesday, September 17, 2008

That branch of Lake Como, which turns south

The airport in Frankfurt is an enclosed space where everybody comes from at least a thousand kilometers from the next person and speaks a radically different language. The planners made it all work by abstracting the semiotic common ground of humanity. The operators make it all work with a perfectly executed clockwork.

What a different experience getting off the airplane in Malpensa. Everybody looks the same and speaks the same language with the same accent. And while an hour earlier in Frankfurt it was silent like in a mausoleum, in Malpensa it is busy and loud like in a bazar.

Everybody seems to have two cell phones, one ringing and the other being used to exchange trivialities with remote people. And people keep talking to everybody around them. Sure, unlike the people in Frankfurt, these people can. But strangers keep asking me when their suitcase will come out, how long it will take, where they will have to go next…

I place myself under the carousel's display, where I can just rise my finger and point to the display. What do I know? Later, driving to the hotel, my host Prof. Rizzi explains me that I witnessed the Italian version of the GPS: you just constantly ask the people around you for directions. I guess that works in a society where most people walk.

The autostrada takes some getting used to, when one normally cruises on 101 or 280. But then, everybody is watching — no spaced out people juggling a coffee mug in one hand and a cell phone in the other. And there is not the heavy metal protection of an SUV.

We arrive at the hotel for the invited keynote speakers. I am surprised. The Comaschi, the people from Como, especially the business people, are known for having short arms (meaning they cannot easily reach in their pockets to take out their bill-fold). Yet, here they put us up in the best hotel in town.

Not only, they put us in the best rooms in the best best hotel in town. What a view! As you see in the pictures, in front of us is that branch of Como Lake, which turns south, between two uninterrupted mountain chains, all peninsulas and bays, depending on their sticking out or caving in, becomes, all the sudden, constricted, and becoming like a river…

Quel ramo del lago di Como, che volge a mezzogiorno, tra due catene non interrotte di monti, tutto a seni e a golfi, a seconda dello sporgere e del rientrare di quelli, vien, quasi a un tratto, a ristringersi, e a prender corso e figura di fiume, tra un promontorio a destra, e un'ampia costiera dall'altra parte; e il ponte, che ivi congiunge le due rive, par che renda ancor più sensibile all'occhio questa trasformazione, e segni il punto in cui il lago cessa, e l'Adda rincomincia, per ripigliar poi nome di lago dove le rive, allontanandosi di nuovo, lascian l'acqua distendersi e rallentarsi in nuovi golfi e in nuovi seni.

What a suffering it was in middle school, and what a gorgeous sight it is now.

When we arrive at the conference venue, we find a mixture of preoccupation, panic, and emergency. The proceedings did not arrive, and nobody knows who is in charge. Only the badges for people at the beginning and end of the alphabet are here, the others are missing. There is no wireless, where is IT? The janitor does not know. Short rapid conversations.

Then everybody pulls out their two cell phones. Is it high noon? No, every person in the hallways is communicating simultaneously on each of ten channels: the first cell phone in one hand talking to one person, the other cell phone in the other hand talking to a second person, both phones announcing the arrival of an SMS after another, talking to several people in the room, and orchestrating the hole gesticulating with the hands. What a cacophony!

Suddenly people start showing up. "Good afternoon, I am the one for the coffee." "Good afternoon, I am the IT manager." And so on. Everybody is proposing a contribution. What is amazing to somebody accustomed to the American way of doing business is that there are no negotiations, no power games, no delays to talk things over with the boss.

Everybody only makes positive proposals. Everybody has personal authority to make decisions. Numbering systems and spreadsheets are set up so there is full accountability on everything. After less than two hours the whole conference has been organized on the spot and everybody is satisfied that it is better than they had anticipated. It is time to part because it will be a long evening and night to get everything done to perfection.

It comes to my mind that everybody here in middle school has learned Nicolò Macchiavelli's Prince and knows how to manage well. In fact, here the whole Prince is summarized in the few lines of a vernacular haiku:

fin che ga né…

viva el re…

Quand ghe né pü…

crepa l'asan e quel che gh'é sù.

Mr. Bill Hewlett would have added "and we do not need any stinking Voice of the Workforce surveys."

Monday, September 15, 2008

Visit to the sausage factory

Scientific research is a struggle with many wrong turns and lots of meticulous detail work. Then, after the Eureka moment, we reorder our ideas and write it all up in a nice clean and easy-to-follow paper.

If you just read papers, scientific research is a glorious activity, where the researcher is like a Zen master waiting for the right moment and then letting the arrow reach the target. Even in the case of Zen, reality is very different from what you see in the movies.

Therefore, scientists gather in conferences. Papers are given in formal presentations, to quickly communicate the final result of the research. However, the real action takes place in the hallways during the breaks and during meals. That is when the presenters are approached and war stories are exchanged.

The trick is to learn from other researcher's experience. It is like visiting the sausage factory so you know what to eat and most of all, what not to eat.

So here is the handout to our next conference presentation: HPL-2008-109.

For those not attending the conference, here is a trip report from the sausage factory.

HP used to have a literature distribution center in Campbell. It warehoused the brochures and other marketing collaterals for all currently shipping products. When sales representatives prepared an offer, they would order the pieces from Campbell and assemble the material in a booklet to present the customer.

Then HP bought Indigo. Now all those printed materials could be replaced by a document repository. The sales reps could "shop" for the required collaterals on a web site and the resulting document would be printed on demand on the Indigo press and finished, resulting in a professional booklet.

Our project built the prototype of this system called DPOD (I cannot recall what the acronym stands for). In alphabetic order, team included Hui Chao, Scott Clearwater, Anna Durante, Parag Joshi, Xiaofan Lin, Greg Nelson, Henry Sang, and Nick Saw.

We were not happy to build just a shopping cart solution as a front-end to a document management system. To maximize the document's impact, we implemented a custom printing system, also known as variable data printing system.

In the middle of the implementation, HP changed the colors in the corporate palette. To have a uniform look for all pieces in a marketing document, we had to automatically change the old corporate colors to the perceptually closest new colors.

Things could go particularly wrong with colored text on colored background. If in the old palette the text was readable, in the new palette it could become illegible. We had to check each foreground-background color pair for readability and then nudge one of the colors.

In the first prototype we did not yet have the code to parse the PDF and nudge the colors there. Instead, we ripped each page and fixed it pixel by pixel. To keep up with the Indigo's print speed, the implementation had to be very efficient. Yet, it also had to be very precise, so the nudged colors were consistent across the entire document.

My first implementation of the small color piece was colorimetric, i.e., I calculated ∆E94 differences and nudged the colors in cylindrical CIELAB coordinates before converting them back to sRGB.

In the second implementation, instead of enforcing a minimal ∆E distance, I enforced a lexical distance. I calculated the color name of the foreground and background colors and ensured there was at least one color name in-between.

Years before, at PARC, Maureen Stone had used the ISCC-NBS color naming system, so I looked for something different to implement.

The basic scheme for ISCC-NBS color names

I found that most of the naming research in the literature was focused on the basic color terms, so I settled with the Coloroid color naming system. Here is how the leaf for hue A = 20 looks:

Coloroid color names

There are many white areas in the plot. In addition, to make things run fast, there is no time for gamut mapping, so the entire addressable color range must be tiled, for a resulting naming algorithm as follows:

modified Coloroid names

The system worked so well, we made a follow-up for a product called MoD, for marketing on demand. It was a web service that would allow small and medium businesses (SMB) to create their own professional marketing collaterals. By "their own" we mean that instead of hiring an expensive graphic designer, they can get done a comparable collateral by an administrative assistant.

To avoid complexities like spec sheets for logos, we extended the color discrimination algorithms to work for any vector graphics element on a page. For example, the colored logo works on any background color from HP's corporate palette, as shown in these examples:

on black on blue 2004

on white on ocher

on ocher dark on ocher liht

on orange on orange light

on purple dark purple light

If we compare the web service to a minivan, then with our system we provided it with a racing car engine. Of course, from car manufacturers we learned that the buyer of a minivan hardly ever opens the hood, so there is no point in outfitting it with a racing engine, a lawn mover engine will do it. As my friend Irwin Sobel keeps telling me, the computer industry is learning fast from the US car manufacturer's cost-cutting strategies.

Now that you know what happened in the sausage factory you can read HPL-2008-109. Even better, come to the conference, where you can ask all your questions and learn from our experience.

Sunday, September 14, 2008

Name a color

For some years, Nathan Moroney has been running a multilingual color naming experiment. In the experiment, participants are shown seven color patches picked at random from the sRGB cube. Next to each patch there is a field for entering a name for the color.

The random distribution is uniform, so one would expect to obtain a uniform distribution of color names. However, this is not so. There are eleven basic color terms that come to mind very fast, so one can expect to hear them more often.

Naming colors is an acquired skill, so it will depend on the participant's socioeconomic status (SES). Participants in the color naming experiment tend to be from a high SES, so one would still expect a to get a fair amount of non-basic color terms.

Well, here is the data:

distribution of color names

We are plotting the 101 most frequent color names collected so far in the experiment. For navigation, the abscissa marks each fifth color name from the ordered list above.

For a number of reasons, in such a crowd-sourcing experiment there is low precision and there is a certain amount of bogus data. This is handled by weighting and averaging the contributions.

The distribution's long tail entails that a large amount of data needs to be collected to obtain a reasonably rich color name dictionary. A rich dictionary is important, because for us color scientists it is not the dictionary itself that is of most interest (linguists deal with that). What we are interested in, is to invert the data and build a tool that given a color name shows a color patch of that name. This allows us to help you improve your color naming skills.

English being the internet's lingua franca, we have sufficient data in English. However, in the other languages we have insufficient data to be able to average the non-basic color terms.

At this time we call for readers speaking Italian. If you do, please help us by naming colors in Italian at this link. Your contribution will make the color thesaurus more useful.

Grazie mille!

Thursday, August 28, 2008

Noticing is remembering

In last week's post on fan color appearance, I wrote that in low light conditions today's top cameras do not reproduce faithfully color appearance because they remain photopic, in opposition to the human visual system which becomes scotopic. The result shown in the photographs was that while we humans see the crowd achromatic and the LED fans chromatic, the camera reproduced the fans achromatically and the crowd chromatically.

Reality is always more complex. For the camera, the image is flat, i.e., each photosite or pixel has the same importance. However, for the human visual system an object that attracts attention by being bright, colorful, and rapidly moving gets more memory resources allocated, i.e., it is more memorable. This fact makes the photopic/photopic confusion more striking for the photographers themselves than for viewers not present at the event.

The lesson is actually more general. Color scientists who are serious about their research still do psychophysics experiments. When designing these experiments, it is important not to overstretch the observer's memory capacity, because it might skew the experiment.

For more on this topic, the recent paper Dynamic Shifts of Limited Working Memory Resources in Human Vision by Paul M. Bays and Masud Husain in Science 8 August 2008: Vol. 321. no. 5890, pp. 851-854 presents the results of recent research on visual memory. Here is the editor's summary:

The dominant model of human visual working memory allows for the simultaneous representation of only three or four objects. With what precision is each visual object stored as a function of the number of items in a scene? Bays and Husain tested the ability of human subjects to remember the location and orientation of multiple visual items after a brief disappearance of the stimulus array, and found that visual working memory is a flexibly allocated resource. Making an eye movement toward an object, or directing covert attention to it, caused a greater proportion of memory resources to be allocated to that object, allowing the memory of its presence to be retained with far greater precision than other objects in the scene.

Saturday, August 23, 2008

Fan color appearance

One of the key accessories for 盆踊り (bon odori) is the flat fan or 団扇 (uchiwa). The best ones are made by creating a bone skeleton with bamboo from 四国 (Shikoku), on which 和紙 (washi, Japanese paper) is glued.

At this year's パロアルト (Palo Alto) お盆 (obon), I noticed that instead of the usual artistic fans with delicate designs, many dancers were wearing plastic fans like those handed out in hot summer nights by beer companies as marketing tools. I was surprised—with the consul here, why something so tacky?

It was only as the dance progressed and dusk had my vision switch from photopic to mesopic, that I discovered the secret. Today's flat fans are made with designs created by elaborate multicolored LED patterns and wave guides molded in the plastic fan. As the day wanes and vision progresses towards scotopic, these modern 団扇 (uchiwa) become eerie, creating an atmosphere where the living look more like the dead ancestors coming to visit us during お盆 (obon).

Scary! Has 四国 (Shikoku) been unsealed and become 死国 (Shikoku)?

And now to the challenge for color imaging. Below are photographs of paroaruto's bon odori in chronological order. As you note, the camera remains photopic. It cannot render correctly the fan color appearance and the scariness has completely disappeared.

Back to the drawing board! We need color rendering algorithms that can reproduce accurately the color appearance of contemporary flat fans.