Showing posts with label imaging. Show all posts

Thursday, October 5, 2017

Computational Near-Eye Displays with Focus Cues

SCIEN has resumed at Stanford with the talk Computational Near-Eye Displays with Focus Cues by Gordon Wetzstein. This presentation is an overview of research at Stanford.

Inflection points in near-eye displays:

  • 1838 Stereoscopes by Wheatstone, Brewster, …
  • 1968 Ivan Sutherland
  • 1995 Nintendo Virtual Boy
  • 2012–2017 VR explosion

Currently, the big enablers are the smartphone components.

The main purpose of the lenses in near-eye displays is to set the virtual image further away because we cannot focus too close.

Stereoptics is binocular; the mechanism of vergence is cued by binocular disparity. Focus cues are monocular; the mechanism of accommodation is cued by retinal blur.

The big problem is the vergence-accommodation conflict..

Gaze-contingent focus. For non-presbyopes, the adaptive focus is like the real world, but it requires eye tracking. Presbyopes need a fixed focal plane with correction.

Light field displays are not yet well-developed. The idea is to project multiple different perspectives into different parts of the pupil. Example: tensor displays. Light field displays are limited by diffraction.

The next step is multifocal lenses: point spread function engineering.

The challenges for AR are

  1. Design thin beam combiners using waveguides
  2. Eye box vs. field of view trade-off
  3. Eye tracking
  4. Chromatic aberrations
  5. Occlusions; difficulty: need to block real light

Only a few mm of physical display displacement results in a large change of the perceived virtual image

Tuesday, July 4, 2017

Imaging and Astronomy

At the 2018 IS&T International Symposium on Electronic Imaging (EI 2018), taking place 28 January – 1 February 2018 at the Hyatt Regency San Francisco Airport, Burlingame, California, Prof. Daniele Marini is organizing a joint session on imaging and astronomy.

This new session brings together amateur and professional astronomers, vision scientists, color scientists, astrophysicists, data visualization specialists and all others with interest in astronomy and photography. Astronomers and others interested are invited to submit papers considering different aspects of digital imaging that are relevant for astronomical imaging, image processing, and data visualization, e.g., including color reproduction, display, quality, and noise.

We anticipate that the astronomical imaging community will have an exceptional opportunity to connect with digital imaging professionals and exchange experiences. If your work in the field of photography of astronomic subjects, We would be delighted to have you as a speaker discussing your work. Please use this link for your submission.

Rob Buckley, Shoji Tominaga, and Daniele Marini

Daniele Marini (right) receives the IS&T Fellow award with Shoji Tominaga (center) and Rob Buckley (left).

Thursday, April 13, 2017

Computational Imaging for Robust Sensing and Vision

In the early days of digital imaging, we were excited about having the images in numerical form and not being bound by the laws of physics. We had big ideas and quickly ran for their realization. However, we immediately reached the boundaries of the digital world: the computers of the day were too slow to process images, did not have enough memory, and the I/O was inadequate (from limited sensors to non-existing color printers).

Now has finally come the time when these dreams can be realized and computational color imaging has become possible, thanks to good sensors and displays, and racks full of general purpose graphical processing units (GPGPUs) with hundred of gigabytes of primary memory and petabytes of secondary storage. All this, at an affordable price.

Wednesday, 12 April 2017, Felix Heide gave a talk at The Stanford Center for Image Systems Engineering (SCIEN) with the title Capturing the “Invisible”: Computational Imaging for Robust Sensing and Vision. He presented three implementations.

One application is image classification. In the last couple of years we have seen what is possible with deep learning when you have a big Hadoop server farm and millions of users who provide large data sets they carefully label, creating gigantic training sets for machine learning. Felix Heide uses Bayesian inference to implement a much better system that is robust and fast. It better leverages the available ground-truth and uses proximal optimization to reduce the computational cost.

To facilitate the development of new algorithms, Felix Heide has created the ProxImaL Python-embedded modeling language for image optimization problems, available from www.proximal-lang.org.

computational imaging

Quantum imaging beyond the classical Rayleigh limit

A decade has passed since we were working on quantum imaging, as we reported in an article in the New Journal of Physics that was downloaded 2316 times. We had described the experimental set-up in a second article in Optics Express that was viewed 540 times. It is interesting that the second article was most popular in May 2016, indicating we were some 6 years ahead of time with this publication and over 10 years ahead when Neil Gunther started actively working on the experiment. The problem of coming too early is that it is more difficult to get funding.

Edoardo Charbon continued the research at the Technical University of Delft, where he built a true digital camera that used a built-in flash to create a three-dimensional model of the scene, and the sunlight to create a texture map of the image that could be mapped on the 3-d model. This is possible because the photons from the built-in flash—a chaotic light source that produces the photons from excited particles—and those from the sun—which is a thermal radiator (hot body)—have different statistics.

We looked at the first- and second-order correlation functions to tell the photons from the flash from those originating in the sun. Since the camera controlled the flash, the photon's time of flight could be computed to create the 3-d model. The camera worked well up to a distance of 50 meters.

I am glad that Dmitri Boiko is still continuing this line of research. With a group at the Fondazione Bruno Kessler (FBK) in Trento, Italy and a group at the Institute of Applied Physics at the University of Bern in Bern, Switzerland, he is working on a new generation of optical microscope systems by exploiting the properties of entangled photons to acquire images at a resolution beyond the classical Rayleigh limit).

Read the SPIE Newsroom article Novel CMOS sensors for improved quantum imaging and the open access invited paper SUPERTWIN: towards 100kpixel CMOS quantum image sensors for quantum optics applications in Proc. SPIE 10111, Quantum Sensing and Nano Electronics and Photonics XIV, 101112L (January 27, 2017).

Wednesday, June 22, 2016

9,355,339: system and method for color reproduction tolerances

In the early days of digital imaging for office use, there was a religion that the response of the system had to be completely neutral. The motivation came from a military specification that a seventh generation copy had to still look good and be readable. If there would be a deviation from neutrality, every generation would enhance this deviation.

When a Japanese manufacturer entered the color copier market, they enhanced the images to improve memory colors and boost the overall contrast. They were not selling to the government and rightfully noted that commercial users do not do multiple generation copies.

Color is not a physical phenomenon, it is an illusion and color imaging is about predicting illusions. Visit your art gallery and look carefully at an original Rembrandt van Rijn painting. The perceived dynamic range is considerably larger than the gamut of the paints he used because he distorted the colors depending on their semantics. With Michel Eugène Chevreul's discovery of simultaneous contrast, the impressionists then went wild.

When years later I interviewed for a position in a prestigious lab, I gave a talk on how—based on my knowledge of the human visual system (HVS)—I could implement a number of algorithms that greatly enhance the images printed on consumer and office printers. The hiring engineering managers thought I was out of my mind and I did not get the job. For them, the holy grail was the perfect neutral transmission function.

This neutral color reproduction is a figment of imagination in the engineer's minds in the early days of digital color reproduction. The scientists who earlier invented the mechanical color reproduction did not have this hang-up. As Evans observed on page 599 of [R.M. Evans, “Visual Processes and Color Photography,” JOSA, Vol. 33, 11, pp. 579–614, November 1943], under the illuminator condition color constancy mechanisms in the human visual system (HVS) correct for improper color balance. As Evans further notes on page 596, we tend to remember colors rather than to look at them closely; for the most part, he notes, careful observation of stimuli is made only by trained observers. Evans concludes that it is seldom necessary to obtain an exact color reproduction of a scene to obtain a satisfying picture, although it is necessary that the reproduction shall not violate the principle that the scene could have thus appeared.

We can interpret Evans’ consistency principle (page 600) as what is important is the relation among the colors in a reproduced image, not their absolute colorimetry. A color reproduction system must preserve the integrity of the relation among the colors in the palette. In practice, this suggests that three conditions should be met. The first is that the order in a critical color scale should not have transpositions, the second is that a color should not cross a name boundary, the third is that the field of reproduction error vectors of all colors should be divergence-free. The intuition for the divergence condition is that no virtual light source is introduced, thus supporting color constancy mechanisms in the HVS.

We all know the Farnsworth-Munsell 100 hue test. The underlying idea is that when an observer has poor color discrimination, either due to a color vision deficiency or due to lack of practice, this observer will not be able to sort 100 specimen varying only in hue. In the test, the number of hue transpositions is counted to score an observer.

Farnsworth-Munsell 100 hue test

We can considerably reduce the complexity of a color reproduction system if we focus on the colors that actually are important in the specific images being reproduced. We can minimally choose the quality of the colorants, paper, halftoning algorithm, and the number of colorants to just preserve the consistency of that restricted palette.

First, we determine the palette, then we reproduce a color scale with a selection of the above parameters and we give the resulting color scale image a partial Farnsworth-Munsell hue test. This is the idea behind invention 9,355,339. The non-obvious step is how to select color scales and how to use a color management system to simulate a reproduction. The whole process is automated.

A graphic artist manually identifies the locus of the colors of interest, which is different for each application domain, like reproductions of cosmetics or denim clothes. A scale encompassing these critical colors is built and printed in the margin. In the physical application, the colors are measured and the transpositions are counted.

complexion color scale

The more interesting case is a simulation. There is no printing, just the application of halftoning algorithms and color profiles. The system extracts the final color scale and identifies the transpositions compared to the original. Why is the simulation more important?

Commercial printing is a manufacturing process and workflow design is crucial to the financial viability of the factory. Printing is a mass-customization process, thus every day in the shop is different. This makes it impossible to assume a standard workload.

For each manufacturing task, there are different options using different technologies. For example, a large display piece can be printed on a wide bubblejet printer, or the fixed background can be silkscreen printed and the variable text can be added on the wide bubblejet printer. Another example is that a booklet can be saddle stitched, perfect bound, or spiral bound.
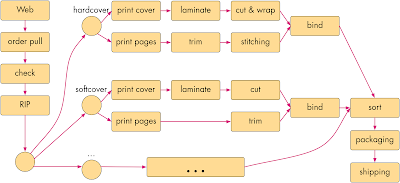
print fulfillment diagam

In an ideal case, a print shop floor can be designed in a way to support such reconfigurable fulfillment workflows, as shown in this drawing (omitted here are the buffer storage areas).

example of a print fullfillment floor rendering; the buffer zones are omitted

However, this would not be commercially viable. In manufacturing, the main cost item is labor. Different fulfillment steps require different skill levels (at different salary levels) and take a different amount of time.

Additionally, not all print jobs are fulfilled at the same speed. A rush job is much more profitable than a job with a flexible delivery time. To stay in business, the plant manager must be able to accommodate as many rush jobs as possible.

This planning job is similar to that of scheduling trains in a saturated network like the New Railway Link through the Alps (NRLA or NEAT for Neue Eisenbahn-Alpentransversale, or simply AlpTransit). For freight, it connects the ports of Genoa and Rotterdam, with an additional interchange in Basle (the Rotterdam–Basel–Genoa corridor). For passengers, it connects Milan to Zurich and beyond. There are two separate basis tunnel systems: the older Lötschberg axis and the newer Gotthard axis. In the latter, freight trains travel at least at 100 km/h and passenger trains at least at 200 km/h. These are the operational speeds, the maximal speed is 249 km/h, limited by the available power supply.

The trains are mostly of the freight type, traveling at the lower operational speed. A smaller number of passenger trains travels at twice the operational speed. A freight train can be a little late, but a passenger train must always be on time lest people miss their connections, which is not acceptable.

The trains must be scheduled so that passenger trains can pass freight trains when these are at a station and can move to a bypass rail. However, there can be unforeseen events like accidents, natural disasters, and strikes that can delay the trains on their route. The manager will counter these problems by accelerating trains already in the system above their operational speed when there is sufficient electric power to do so. This way, when the problem is solved, there is additional capacity available.

The problem with modifying the schedule is that one cannot just accelerate trains: new bypass stations have to be determined and the travel speeds have to be fine-tuned. Train systems are an early implementation of industry 4.0 because the trains also automatically communicate between each other to avoid collisions and to optimize rail usage. For AlpTransit this required solving the political problem of forcing all European countries to adopt a new ERTMS/ETCS (European Train Control System) Level 2, to which older locomotives cannot be upgraded.

The regular jobs and rush jobs in a print fulfillment plant are similar. The big difference is that the train schedule is the same every day, while in printing each day is completely different. The job of the plant designer is to predict the bottlenecks and do a cost analysis to alleviate these bottlenecks. In particular, deadlocks have to be identified and mitigated. There are two main parameters: the number and speed of equipment, and the amount of buffer space. Buffering is highly nonlinear and cannot be estimated by eye or from experience. The only solution is to build a model and then simulate it.

We used Ptolemy II for the simulation framework and wrote Java actors for each manufacturing step. To find and mitigate the bottlenecks, but especially to find the dreaded deadlock conditions, we just need to code timing information in the Java actors and run Montecarlo simulations.

We used a compute cluster with the data encrypted at rest and using Ganymed SSH-2 for authentication with certificates and encryption on the wire. Each actor could run on a separate machine in the cluster. The system allows the well-dimensioned design of the plant, its enhancement through modernization and expansion, and the daily scheduling.

So far, the optimization is just based on time. In a print fulfillment plant, there are also frequent mistakes in the workflow definition. The workflow for a job is stored in a so-called ticket (believe me, reaching a consensus standard was more difficult than for ERTMS/ETCS). One of the highest costs in a plant is an error in the ticket, which causes the job to be repeated after the ticket has been amended. With this, risk mitigation through ticket verification is a highly valuable function, because it allows a considerable cost reduction for not having to allocate insurance expenses.

While in office printing A4 or letter size paper are the norm, commercial printers use a possibly large paper size to save printing time and, with it, cost. This means there are ganging and imposition, folding, rotating, cutting, etc. It is easy to make an imposition mistake and pages end up in the wrong document or at the wrong place. Similarly, paper can be cut at the wrong point in the process or folded incorrectly.

Once we have a simulation of the print fulfillment factory, we can easily solve these workflow problems, thus reducing risk and with it insurance cost. The data for print jobs is stored in portable document format (PDF) files. For each workstation in a print fulfillment plant, we take the Java actor implemented for the simulation and add input and output ports for PDF files. We then implement a PDF transformer for each workstation that applies the work step to the PDFs. There can be multiple input and output PDFs. For example, a ganging workstation takes several PDF files and outputs a new PDF file for each imposed sheet.

Most errors happen when a ticket is compiled. After simulating the workflow, the operator simply checks the resulting PDF files. A mistake is immediately visible and can be diagnosed by looking at the intermediate PDF files. A more subtle error source is when workstations negotiate workflow changes in the sense of the industry 4.0 technology. Before the change can be approved, the workflow has to be simulated again and the difference between the two output PDF files has to be computed.

A more valuable, but also more complex workflow change is accommodating rush jobs by taking shortcuts. For example, if there is a spot color in the press, can we reuse the same color or do we have to clean out the machine to change or remove the spot color? Another example is the question of using dithering instead of stochastic halftoning to expedite a job. Finally, earlier we mentioned the possibility of running a fixed background through a silkscreen press and printing only the variable contents on a bubblejet press.

In a conventional setting, any such change requires doing a new press-check and having the customer come in to approve it. In practice, this is not always realistic and the owner will use his best judgment so self-approve the proof.

9,355,339 automates this check and approval. The ICC profiles are available and can be used to compute the perceived colors in each case. The transposition score for the color scale (there can be more than one) can predict the customer's approval of the press-check.
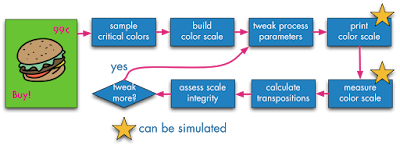
9,355,339 automates the press-check and approval

Thus, we have created a Java actor that simulates a human and can predict the human's perception. This is an industry 4.0 application where we not only have semantic models for the machines but also for the humans, and the machines can take the humans into consideration.

simulating the human in the loop

Thursday, January 28, 2016

Impact of New Developments of Colour Science on Imaging Technology

Yesterday afternoon, at the Stanford Center for Image Systems Engineering, Dr. Joyce Farrell hosted Prof. M. Ronnier Luo for an update on the latest activities at the International Commission on Illumination (CIE), of which he is the Vice-President. He focussed on the aspects relevant to imaging.

Division 7, terminology, has been disbanded because it has finished its work. The e-ILV can be accessed at this link.

There is a new CIE 2006 physiologically based observer model with XYZ functions transformed from the CIE (2006) LMS functions. These functions are linear transformations of the cone fundamentals of Stockman and Sharpe, the 10º LMS fundamental colour matching functions. In the plot below, you can see the 2º XYZ CMFs transformed from the CIE (2006) LMS cone fundamentals. Note the different shapes around 450 nm compared to the 1931 and 1964 observer models.

XYZ CMFs transformed from the CIE (2006) LMS cone fundamentals

The new model is a pipeline in whose stages the age-related parameters can be set. The 10º LMS functions are corrected for the absorption of the ocular media and the macular pigment, and take into account the optical densities of the cone visual pigments, all for a 10° viewing field, yielding the low-density absorbance functions of these pigments. Using these low-density absorbance functions one can derive, taking into account the absorption of the ocular media and the macula, and taking into account the densities of the visual pigments for a 2° viewing field, the 2° cone fundamentals.

There is also a new luminous efficiency function V(λ), which has changed mostly in the blue region.

There are new scales for whiteness and blackness, which corresponds to those in the NCS system. They are based on the comprehensive CAM16 appearance model. Considering a hue leaf of CIELAB in cylindrical coordinates, the south–east ↘ diagonal scale is whiteness–depth and the north–east ↗ is blackness–vividness. These new scales are particularly useful in imaging for adjusting complexion. The skin colors of Asian and Caucasian people vary along the whiteness–depth scale and those of African people vary along the blackness–vividness scale.

Next, Ronnier explained the new color rendering index (CRI) that works also for LED light sources. He also presented a very compelling demonstration of the apparatus used to develop the standard. The new color rendering index is called CRI 2010 and IESNA-TM40. It is based on the measurement of 99 test samples.

I was a little disappointed that the new CRI is still based on colorimetry and not on spectral data. Using colorimetry is an analytical process and having a much larger number of samples helps. However, it does not allow a full characterization of a light source, as we learned many years ago with the tri-band fluorescent lamps. They use less energy, but at the cost of quality.

In this case, I am not too much of a fan of the energy reduction because in practice when you reduce the cost of running a light, people will just deploy more lights and in the end you do not save energy. This is so in consumer applications and does not hold for industrial applications.

Our environment is not made out of BICRA tiles and usually, we are not in aperture mode. We perceive complex images and the light from a set of spot lamps modulates our ambient. While in the case of OLED or fluorescent lamps we might have diffuse light, with LEDs and conventional halogen spot lamps we have more of a set of directed sources with a rapid fall-off.

The rooms in my house are painted in a fusion Italian and Japanese style. The colors are vivid (Italian style), but the paints have a very peaked spectrum so the color is modulated by the illumination (Japanese style). We use older high-quality LED sources with two different green phosphors (the additional one is based on Europium), which we dim. The visual effect is similar to candlelight, except for the correlated color temperature (CCT).

From my experience, I think that a CRI model should include the difference between the spectral distributions of the light source and the reference illuminant. I would also like to have two different reference distributions, A for mood light and D for work light. For thousands of years, we have evolved performing work in daylight and relaxing in blackbody radiator light from fires, oil lamps, and candles. When we want to be in a cozy mood, we pull out the candles, which is also common in upscale restaurants. Candles are more expensive and dangerous than LEDs in houses built from flammable materials.

Should the new CRI also have a provision for the blue hour? Ronnier concluded his presentation stating that the new research topic is tunable white.

Wednesday, August 12, 2015

9,098,487: categorization based on word distance

One of the correlates for the social appreciation or value of scientists is the Gini coefficient. Indeed, poor people cannot afford technologies that make their lives more comfortable (and would not be able to amortize the investment anyway because their labor has little value). Rich people also cannot necessarily amortize the investment in new technology, because they can just hire the poor to do the work for them for a low pay. What drives technology is a low Gini coefficient, because it is a broad middle class that can and does invest in new technologies that makes their lives more efficient.

Worldwide, over the past two centuries the Gini factor has been on the rise, yet there has been incredible technological progress. This means we have to look at a smaller geographical scale. Indeed, for the late 2000s, the United States had the 4th highest measure of income inequality out of the 34 OECD countries measured, after taxes and transfers had been taken into account. As it happens, except for the medical sciences, the American science establishment is only a pale shadow of what it was half a century ago.

In this context, we were naive when three years ago we embarked to solve an efficiency problem for customers processing medical bills, invoices and receipts. These artifacts are still mostly on paper and companies spend a huge amount of time having minimum wage people ingesting it for processing in their accounting systems. In the datasets we received from the customers, the medical bills were usually in good physical shape, but the spelling checkers in the OCR engines had a hard time cracking the cryptic jargon. Receipts were in worst physical shape, printed on poor printers and crumpled, and often imaged by taking a picture with a smart phone.

Surprisingly, invoices were also difficult to process. They often had beverage stains and sometimes they had been faxed several times using machines that looked like they had mustard on the platen and mayonnaise under the lid. But the worst was that in the datasets we received, the form design of the invoices was very inconsistent: the fields and their labels were all over the place, many gratuitous and inconsistent abbreviations were used, etc.

Considerable effort had been spent in the 80s to solve this problem by people like Dan Bloomberg with his mathematical morphology methods to clean up the scanned images (Meg Withgott coined the phrase "document dry cleaning") and Rob Tow with David Hecht and others invented the glyph technology to mark forms so that the location and semantics of each field could be looked up. Maybe due to the increasing Gini coefficient they were not commercially successful. However because this time we had actual customers, we decided to give it another go.

Note that OCR packages already have pretty good built-in spelling checkers, so we are dealing with hard cases. The standard approach used in semantic analysis is based on predetermining all situations for a lexeme and store them into NoSQL databases. In our applications this turned out to be too slow: we needed a response time under 16 µs.

Looking at our dataset, we had a number of different issue types:

  • synonym: a word or phrase that means exactly or nearly the same as another word or phrase in the same language
  • abbreviation: a shortened form of a word or phrase
  • figure of speech: a word or phrase used in a nonliteral sense to add rhetorical force to written passage
  • misspelling: a word or phrase spelled incorrectly
  • mistyping: like misspelling, but depends on the distance between the keys on a keyboard or the stroke classes in the OCR engine
  • metonym: a word, name, or expression used as a substitute for something else with which it is closely associated
  • synecdoche: a figure of speech in which a part is made to represent the whole or vice versa
  • metalepsis: a figure of speech in which a word or phrase from figurative speech is used in a new context
  • kenning: a compound expression in Old English and Old Norse poetry with metaphorical meaning
  • acronym: an abbreviation formed from the initial letters of other words and pronounced as a word

In addition to computational speed, we wanted to be able to address each of these constructs explicitely. In the following we call a lexeme "category" because the used process is a categorization more than a linguistic analysis.

We solved the problem by introducing a metric, so that we could deal with everything as distances and intervals. For the metric we chose the edit distance, also known as Levenshtein distance: the number of edits used to change a first word in the category into a second word in the category, such as using additions, deletions, substitutions, and transpositions. This metric can be computed very fast. We also tried the Damerau-Levenshtein distance, but in this application it did not make a difference.

With a metric, everything was simple. We took the lexemes in each category and computed the center of gravity to determine the prototype for each category and the diameter of the category. The category then received a label that is the word or phrase used in the document typing application.

interval of a lexeme

With misspellings the diameters could be small, but with with synonyms and figures of speech the intervals could be quite large and can overlap. The intersections could easily be computed. Because in all three out datasets the dictionaries were small, we easily resolved the overlaps visually by constructing a graph in which each node had the category diameter as the value and the edges between two nodes had their Levenshtein distance as a weight. Then we plotted the graph with Gephi and split up the overlapping categories into smaller one with the same label.

With this, document typing became very fast: for each word or phrase we looked into which category it fell, and in there we looked for a match. When there was one, we replaced it with the lexeme's label, when not, we added it to the category and logged it for manual verification.

Patent 9,098,487 was filed November 29, 2012 and issued August 4, 2015.

Sunday, January 4, 2015

International Year of Light

Here in Switzerland the weather tends to be bad and we have a Zwinglian/Calvinistic Leitkultur, which might explain our tendency towards pessimism and feeling more unlucky than lucky: it is customary to first look at the negative side of things and then to let us be surprised and feel lucky when things turn out to be positive. In this context, nobody is surprised when the newspapers announce the new year by listing negative anniversaries: 700 years Morgarten, 500 years Marignano, 70 years end of World War II.

Today's Zürich is home to many computer science labs and the city has as many nerds as gnomes (the equivalent persona in banking). They may see 2015 as the year of the palindrome, because 201510 = 111110111112. Or the many mathematicians in Zürich will see 2015 as a Japanese cube, because in the Japanese calendar it is 平成27年 or Heisei 27 = 33. For movie buffs, this year is MMXV.

For color scientists, 2015 is the International Year of Light and Light-based Technologies, a United Nation observance that aims to raise awareness of the achievements of light science and its applications, and its importance to humankind. The IYL 2015 will launch at the UNESCO headquarters in Paris on 19 January 2015, with the unveiling of 1001 Inventions and the World of Ibn Al-Haytham.

Indeed, 2015 marks the anniversaries of several events related to light, optics, and vision:

  • 1015, a millennium ago, the Iraqi scientist Ibn Al-Haytham published his Book of Optics
  • 1815 Augustin-Jean Fresnel proposed the notion of light as a wave
  • 1865 James Clerk Maxwell proposed the electromagnetic theory of light propagation
  • 1915 Albert Einstein embedded his 1905 theory of the photoelectric effect into cosmology through general relativity
  • 1965 Arno Penzias and Robert Woodrow Wilson discovered the cosmic microwave background
  • 1965 Charles Kao theorized and proposed to use glass fibers to implement optical broadband communication

In ancient Greece, there where two competing theories of vision. One theory was called the emission theory (Euclid, Ptolemy) and claimed that vision worked by little flame exiting the eye, traveling on rays, scanning the objects in the visual field, and traveling back to the eye reporting what they detected. In the intromission theory (Aristotle), when an object is looked at, it replicates itself and the replica travels along a ray into the viewer's eye, where it is seen.

For a millennium, there was a raging discussion of whether the emission theory or the intromission theory was the correct one. This discussion was based purely on theoretical considerations and heuristics. In his 1015 book, Ibn Al-Haytham introduced the modern concept of scientific research based on experimentation and controlled testing that we still use today: a hypothesis is formulated, an experiment is conducted varying the parameters, the results of the experiment are discussed, and the conclusions are drawn. Because of this, Ibn Al-Haytham is often referred to as the first scientist.

Using the scientific method, Ibn Al-Haytham developed the first plausible theory of vision. Among other contributions, he also explained the camera obscura and catoptrics. He has strongly influenced later scientists like Averroes, Leonardo da Vinci, Galileo Galilei, Christian Huygens, René Descartes, and Johannes Kepler.

Ibn Al-Haytham's full name was Abū ʿAlī al-Ḥasan ibn al-Ḥasan ibn al-Haytham. His Latinized name was originally Alhacen; since 1572, when Friedrich Risner misspelled his name, in the West he has been known as Alhazen. He was born and raised in Basra, where he initially worked. Later he worked in Baghdad and Cairo.

For more information on the International Year of Light see here.

Tuesday, June 24, 2014

Portraits reveal rare disorders

Doctors faced with the tricky task of spotting rare genetic diseases in children may soon be asking parents to email their family photos. A computer program can now learn to identify rare conditions by analysing a face from an ordinary digital photograph. It should even be able to identify unknown genetic disorders if groups of photos in its database share specific facial features.

Read the article in the New Scientist: Computer spots rare diseases in family photos

Wednesday, June 18, 2014

Color facsimile flashback

Recently a friend showed me on YouTube a movie called Silicon Valley. The movie mostly introduced characters and their environment, finishing without a conclusion, so I suspect it is an episode from a TV series. The setting is a stereotype of the Web 2.0 Silicon Valley and a good part of the plot took place in a company called Hooli, a mini version of real world Google.

If you live in the Silicon Valley the movie might be boring. However, the technology the main character is supposed to have invented got my attention. It is supposed to be a lossless compression algorithm for audio files that can achieve a compression rate of 1:100. Of course, this is impossible as described in the movie, because on a stypical file the lossless compression rate using the Deflate algorithm (Lempel-Ziv followed by Huffman) is about 1:3. The description in the movie is impossible because there is not that much entropy in typical audio files.

Indeed, the writer forgot a qualifier, such as perceptually or better should have written about listening performance.

On that, my colleagues and I happen to have a couple of patents, namely US 5,883,979 A Method for selecting JPEG quantization tables for low bandwidth applications and US 5,850,484 A Machine for transmitting color images.

U.S. Patent 5,883,979 Method for selecting JPEG quantization tables for low bandwidth applications

Facsimile (fax) is an old technology for transmitting images over phone lines that is probably alien to today's readers. In analog fax, the machine consisted of a metal cylinder on which one would affix the page of a document. On the sender side, a head would shuttle in the fast scan direction and at the end of the cylinder the head would shuttle back while the cylinder rotates by one scan line in the slow direction. During the first shuttle, a photosensor in the head would produce a sound in the phone line each time it encounters a black photosite.

At the receiving end, a similar machine would move synchronously and each time a sound arrives in the phone line, it would produce a spark that would burn a dark spot in the paper.

This process was extremely slow, so it would be used only for dense documents. For text documents one would retype the document on a telex machine, which produces a legally valid copy of the text.

Forty years ago I was using fax all the time. When as a field engineer I had an OS crash I could not figure out, I would print out the core dump as a hexadecimal string and fax it from Zürich to Goleta, where the R&D division was. At the time email was not encrypted and people at any forwarding node could and did read the messages. Furthermore, telex was a European thing that was not commonly used in the USA.

A revolution happened in 1964, when Xerox invented the telecopier, which was based on a digital fax technology. The machine would convert the photosites into zeros and ones and store them in a buffer as a digital string. This string would be compressed before being transmitted. There was a hierarchy of compression algorithms that could use 1-d , 2-d coding schemes or pattern matching, with names like MH (ITU T.4), MR, MMR (T.6) and JBIG (T.85).

Having a digital signal that can be compressed with mathematical algorithms, the transmission time dropped dramatically from an hour to under two minutes per page with a typical 9600 baud modem of the time. A dozen years after the Xerox telecopier, Japanese companies were producing very affordable fax machines that became ubiquitous. In Japan, every household had a fax machine, because you could handwrite kanji text on a sheet of paper and fax it, while typing kanas was rather slow.

In 1994 I joined a team inventing the color fax technology. The international effort took place under the ITU umbrella as T.42. For the color encoding we used CIELAB, because being perceptually uniform it allowed the most compact representation. For the spacial encoding we used JPEG.

Compression methods used in color fax

At that time, digital color imaging was still in its infancy (in Windows 3.1 you could only have 16 device colors by default) and the early inkjet printers were fuzzy, as were the early color scanners of the time. The signal processing researchers on the team applied spacial filters to improve the quality of the images, but this actually made the images look worse because the compression artifacts were being amplified.

Artifacts in color fax text

I had the crazy idea of transforming the sharpening algorithm itself to the cosine domain. There the sharpening function could be expressed as a transformation of the DQT, or the quantization tables for the 64 kernels of the discrete cosine transform. We called this image processing in the compressed domain and essentially it consisted in lying about the DQT. For the JPEG encoding we used DQTs optimized for the input image, while the DQT included in the JPEG image was a transformed DQT including the sharpening. This is the essence of patent US 5,850,484.

Office documents consist of a combination of text and image data or mixed raster content (MRC, see here), so we would segment the document stripe by stripe and compress the foreground for example with JBIG, the mask with MMR and the background with JPEG. The ITU standards were T.44 for MRC and T.43 for JBIG in CIELAB.

Even so, transmitting the test targets (e.g., 4CP01) over a 9600 baud line would take 6 minutes per page, which in 1994 was considered unacceptable. At that time the experience was that when a device transitions from black-and-white to color, the price could be at most 25% more and the performance would have to be the same. We felt that a color fax could not take longer than 2 minutes per page on a 9600 baud connection. We achieved 90 seconds.

This prompted us to investigate perceptually lossy compression. In lossless compression, after decompression we obtain exactly the same data as in the input file. In perceptually lossless compression like JPEG or MPEG-2 Audio Layer III (a.k.a. MP3), after decompression we obtain less data, but we cannot perceive the difference. In other words, we leave out the information we cannot perceive anyway. The cosine transform makes the discretization straightforward.

This is like in color encoding we can transform the images to the CIELAB color space because it is perceptually uniform and one unit corresponds approximatively to a JND (just noticeable difference), so we can discretize from floating point to integer without perceiving a difference.

Staying with color, the next step is to further discretize the colors, so that we can perceive a difference (perceptually lossy), but it does not impair our ability to make correct decisions based on the degraded images. This had led us to color consistency and using color names to compare colors. This is related to cognitive color and categorization.

The analogue for the text in mixed documents is reading efficiency, i.e., our reading performance is not reduced based on reading speed or the ability to ready without errors. This is covered by patent 5,883,979, which I explained in this SPIE paper:

Giordano B. Beretta ; Vasudev Bhaskaran ; Konstantinos Konstantinides and Balas R. Natarajan "Perceptually lossy compression of documents", Proc. SPIE 3016, Human Vision and Electronic Imaging II, 126 (June 3, 1997); doi:10.1117/12.274505; http://dx.doi.org/10.1117/12.274505.

perceptually lossy compression

This is a long explanation and you cannot do it in a movie, but at least the script writer should have added the qualifier perceptual in the algorithm name and it would all have been more plausible.

Epilogue

If the invention is sufficiently novel that it can become the basis for a plot in a Hollywood movie twenty years later, why was my professional career a failure? As it happens, 1994 was also the time when the Internet became available to the general public and everybody went on email. An email attachment is more convenient than having a separate fax machine, especially in a crammed Japanese house. Also, the Internet was running on fiber to the home (FTTH) instead of the slow copper phone lines of the phone and fax.

Timing is everything.

Tuesday, April 16, 2013

Tuesday, February 21, 2012

Shining Silver Surfer in the Snow

What do you do with several hundred LEDs? You make a movie like this:

Easy, right? After all, LEDs work better at low temps. Well, maybe not.

Thursday, March 31, 2011

IBEX Camera Sees a Ribbon in the Sky

The NASA IBEX (Interstellar Boundary Explorer) mission (the size of a kitchen table) was launched in 2008 to map the heliosphere that surrounds our solar system. It carries a High-Energy Neutral Atom (HENA) camera that images energetic neutral atoms, rather than photons, to create maps of the boundary region between our solar system and the rest of our galaxy.


The surprise result (so far) is that the energy and particles at the galactic boundary are confined to a "ribbon" structure that envelopes the heliosphere. For reference, the Voyager spacecraft are just now passing through the heliopause, at about 100 AUs, after more than 30 years of in-flight operation. Both the heliosphere and heliopause are shown below on a logarithmic scale.


For the first ten billion kilometres of its radius, the solar wind travels at over a million kilometers per hour. As it begins to drop out with the interstellar medium, it slows down before finally ceasing altogether. The point where the solar wind slows down is the termination shock; the point where the interstellar medium and solar wind pressures balance is called the heliopause; the point where the interstellar medium, traveling in the opposite direction, slows down as it collides with the heliosphere is the bow shock. [Source: Wikipedia]

Monday, March 21, 2011

Large tiled images

Remember the large tiled multiresolution images from Live Picture's IVUE file format and its son FlashPix? Current architectures allow them to make a comeback. New hardware architectures can reduce processing time for gigapixel and terapixel images.

Read the article in the SPIE Newsroom: Multicore speedup for automated stitching of large images.

Thursday, February 24, 2011

Metadata in images

I just received the latest issue of the print version of Optical Engineering in the mail. It has a paper on storing metadata in images that is related to some work I described recently, namely Rob Tow et al.'s glyphs, and the watermarking and steganography work by Gaurav Sharma et al. respectively Robert Ulichney et al.

The citation is: Jen-Chang Liu and Hsiang-An Shieh, "Toward a two-dimensional barcode with visual information using perceptual shaping watermarking in mobile applications", Opt. Eng. 50, 017002 (Jan 21, 2011); doi:10.1117/1.3529430.

The link is: http://dx.doi.org/10.1117/1.3529430.

Wednesday, February 23, 2011

Mik Lamming's Digital Darkroom

In the mid-eighties the world of electronic imaging was still rarified. Researchers were pushing the state of the art on very expensive computers and vying to get their papers into SIGGRAPH. Some years earlier, IBM's monochrome Selectric typewriter and the monochrome Xerox copier had banned color from the office, with the demise of color ribbons (black and red, sometimes blue too) and multicolor mimeographs.

Wednesday, January 19, 2011

Parallel Processing for Image Recognition

In a few days, imaging technologists from around the world will be flocking to the San Francisco Airport Hyatt to attend the Electronic Imaging Symposium.

Monday 24 January from 10:40 AM to 11:10 AM many delegates will fasten their seat-belts in Sandpebble Room D, where IS&T Fellow and HP Labs Director and Distinguished Technologist Dr. Steven J. Simske will be giving his Invited Talk on Parallel Processing Considerations for Image Recognition Tasks in the Conference on Parallel Processing for Imaging Applications.

Many image recognition tasks are well-suited to parallel processing. The most obvious example is that many imaging tasks require the analysis of multiple images. From this standpoint, then, parallel processing need be no more complicated than assigning individual images to individual processors. However, there are three less trivial categories of parallel processing that will be considered in this paper: parallel processing (1) by task; (2) by image region; and (3) by meta-algorithm.

Parallel processing by task allows the assignment of multiple workflows—as diverse as optical character recognition [OCR], document classification and barcode reading—to parallel pipelines. This can substantially decrease time to completion for the document tasks. For this approach, each parallel pipeline is generally performing a different task. Parallel processing by image region allows a larger imaging task to be sub-divided into a set of parallel pipelines, each performing the same task but on a different data set. This type of image analysis is readily addressed by a map-reduce approach. Examples include document skew detection and multiple face detection and tracking. Finally, parallel processing by meta-algorithm allows different algorithms to be deployed on the same image simultaneously. This approach may result in improved accuracy.

Useful links:

Monday, January 17, 2011

Parallel Transparency

Technology allows everybody to do their own work without assistance. When office automation software programs allowed office workers to create professional quality documents, graphic artists had to take the sophistication of high-concept design up to the next level, above the abilities of office tools.

One of the key techniques has been the heavy usage of transparency. Consequently, commercial printers see a large number of documents containing transparency. The specification of transparency in PDF is very sophisticated, well above to the simple transparency used for example in video games.

Therefore, adding transparency to a GPU-based RIP is quite a challenging task. Indeed, not only has the complex PDF transparency to be implemented, but it also necessary to implement an ICC color management module on the GPU. And it all has to work on tiled images.

At the Electronic Imaging Symposium, John Ludd Recker from HP Labs will report on his experience implementing GPU-based transparency in Ghostscript. His lecture on A GPU accelerated PDF transparency engine will be in the Conference on Parallel Processing for Imaging Applications.

Useful links:

Sunday, November 14, 2010

Saturday, November 6, 2010

"The First Pass is Relatively Arbitrarily Picked Colors"

From the summer toPost folder is a hurl from Tim with a link to a Chuck Close interview on Colbert:


Which regardless of your opinion of Colbert, is a remarkable interview. First, Close gets Colbert to say toner. Second, Close describes paintings as "colored dirt on a flat surface". Third, Close checks his hand before revealing he suffers from prosopagnosia.