The National Science Board (NSB, the governing board of the National Science Foundation and policy advisors to the President and Congress) has released the 2010 Science and Engineering Indicators (SEI) report. The report provides a broad base of quantitative information on the U.S. and international science and engineering enterprise. The data are "indicators." Indicators are quantitative representations that might reasonably be thought to provide summary information bearing on the scope, quality, and vitality of the science and engineering enterprise. The indicators reported in SEI are intended to contribute to an understanding of the current environment and to inform the development of future policies.
Here are some data points that might be interesting:
The United States remained by far the single largest R&D-performing country. Its R&D expenditure of $369 billion in 2007 exceeded the Asian region’s total of $338 billion and the EU’s (EU-27) $263 billion. The U.S. 2007 total broadly matched the combined R&D expenditures of the next four largest countries: Japan, China, Germany, and France:
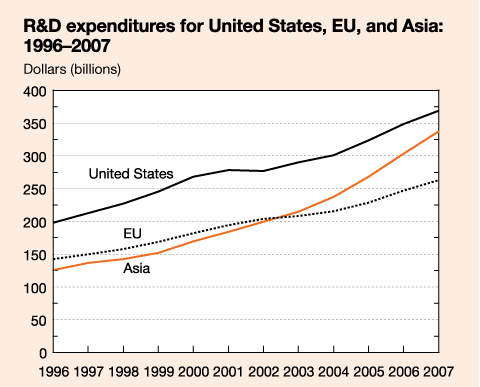
China’s R&D/GDP ratio more than doubled, from 0.6% in 1996 to 1.5% in 2007, a period during which China’s GDP grew at 12% annually—an enormous, sustained increase. The gap in China’s R&D/GDP ratio relative to those of developed economies suggests that China’s R&D volume can continue to grow rapidly:

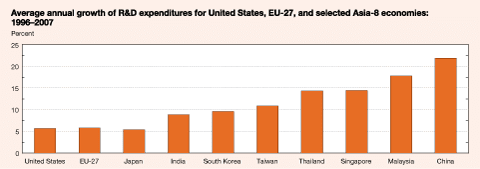
Decade-long R&D growth rates of mature S&T countries differ dramatically from those of developing economies. Growth of R&D expenditures in the United States, the EU, and Japan averaged about 5%–6% annually, not adjusted for inflation. Asian growth ranged from about 9% to 10% for India, South Korea, and Taiwan to more than 20% for China. Asian R&D growth reflects rising private spending by domestic and foreign firms, as well as increased public R&D spending designed to support strategic policies that aim to raise economic competitiveness through the development of knowledge-based economies:
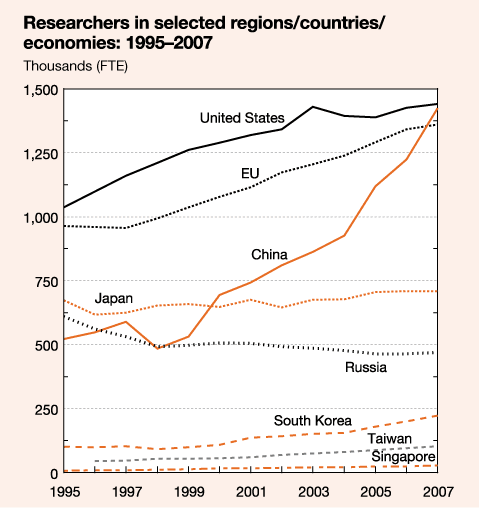
Estimates of the number of the world’s researchers provide broad support for the trends and shifts suggested by the R&D and degree data discussed previously. The estimated number of researchers grew from nearly 4 million in 1995 to about 5.7 million in 2007. The United States and the 27 EU members each accounted for about 1.4 million researchers—a combined 49% of the total but below the 51% share they had held a decade earlier. China’s researchers more than doubled in number, from just over half a million to more than 1.4 million, boosting its world share from 13% to 25% over the period:
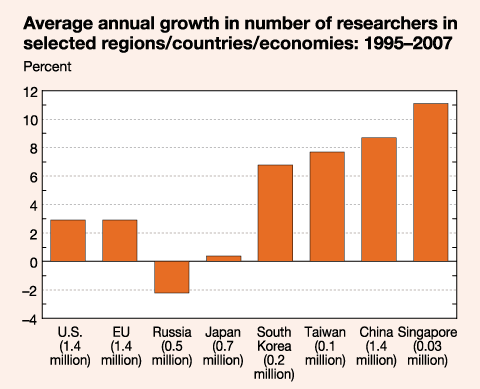
Trends in researcher growth rates vary greatly by country/region. The United States and the EU had moderate annual growth of about 3% between 1995 and 2006. Japan’s rate was below 1%. Growth in the Asian region outside Japan ranged from 7% to 11%. China, the biggest country, averaged nearly 9% growth, including a brief but sharp break in 1998–99 that reflected the rapid conversion of state-owned to privately owned enterprises as a result of the central government’s policy change. Russia’s researcher growth rate, which is now flat, declined over the period:
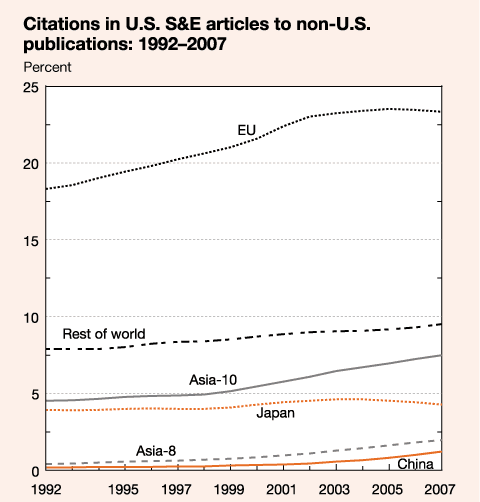
Citations to the work of others in the literature are a broad indicator of the usefulness of this work in ongoing research. Citations to nondomestic articles can indicate the existence of useful work being done elsewhere. Citations in U.S. articles to the domestic literature dropped steadily since 1992 from 69% to 60% in 2007, attesting to the growth of relevant work elsewhere:
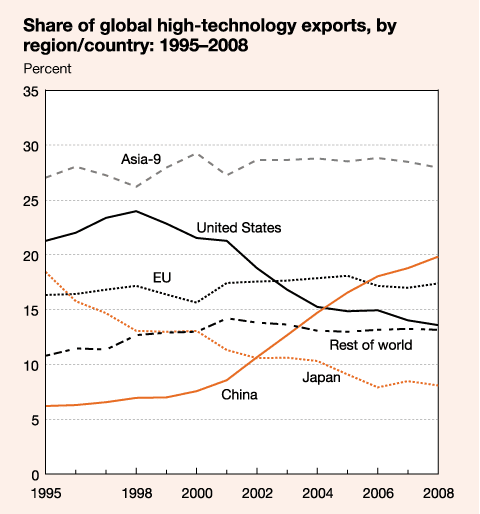
The global expansion of high-technology trade has made China the largest single high-technology exporter and has changed the relative positions of the developed and developing countries. China’s share of world high-technology exports increased from 6% in 1995 to 20% in 2008, while the Asia-9 maintained a 26%–29% share. Japan’s export share eroded from 18% to 8%, the U.S. share dropped from 21% to 14%, and the EU maintained a 16%– 18% share:
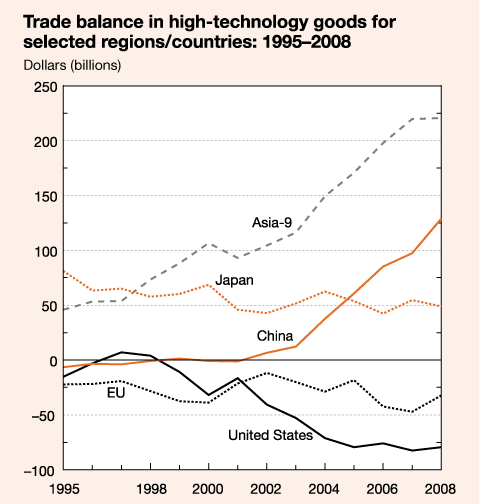
In the high-technology goods trade, the United States had small trade surpluses during the mid- to late 1990s; these turned into a widening deficit after 1998 that has fluctuated at about $80 billion since 2005. The U.S. trade deficit in ICT goods—communications and semiconductors and computers—is larger than that. It reached a record $126 billion in 2007 before contracting marginally to $119 billion in 2008, reflecting recession-induced lowered imports:
Science and technology are no longer the province of developed nations; they have, in a sense, become “democratized.” Governments of many countries have firmly built S&T aspects into their development policies as they vie to make their economies more knowledge- and technology-intensive and, thereby, ensure their competitiveness in a globalizing world. These policies include long-term investments in higher education to develop human talent, infrastructure development, support for research and development, attraction of foreign direct investment and technologically advanced multinational firms, and the eventual development of indigenous high-technology capabilities.


No comments:
Post a Comment