
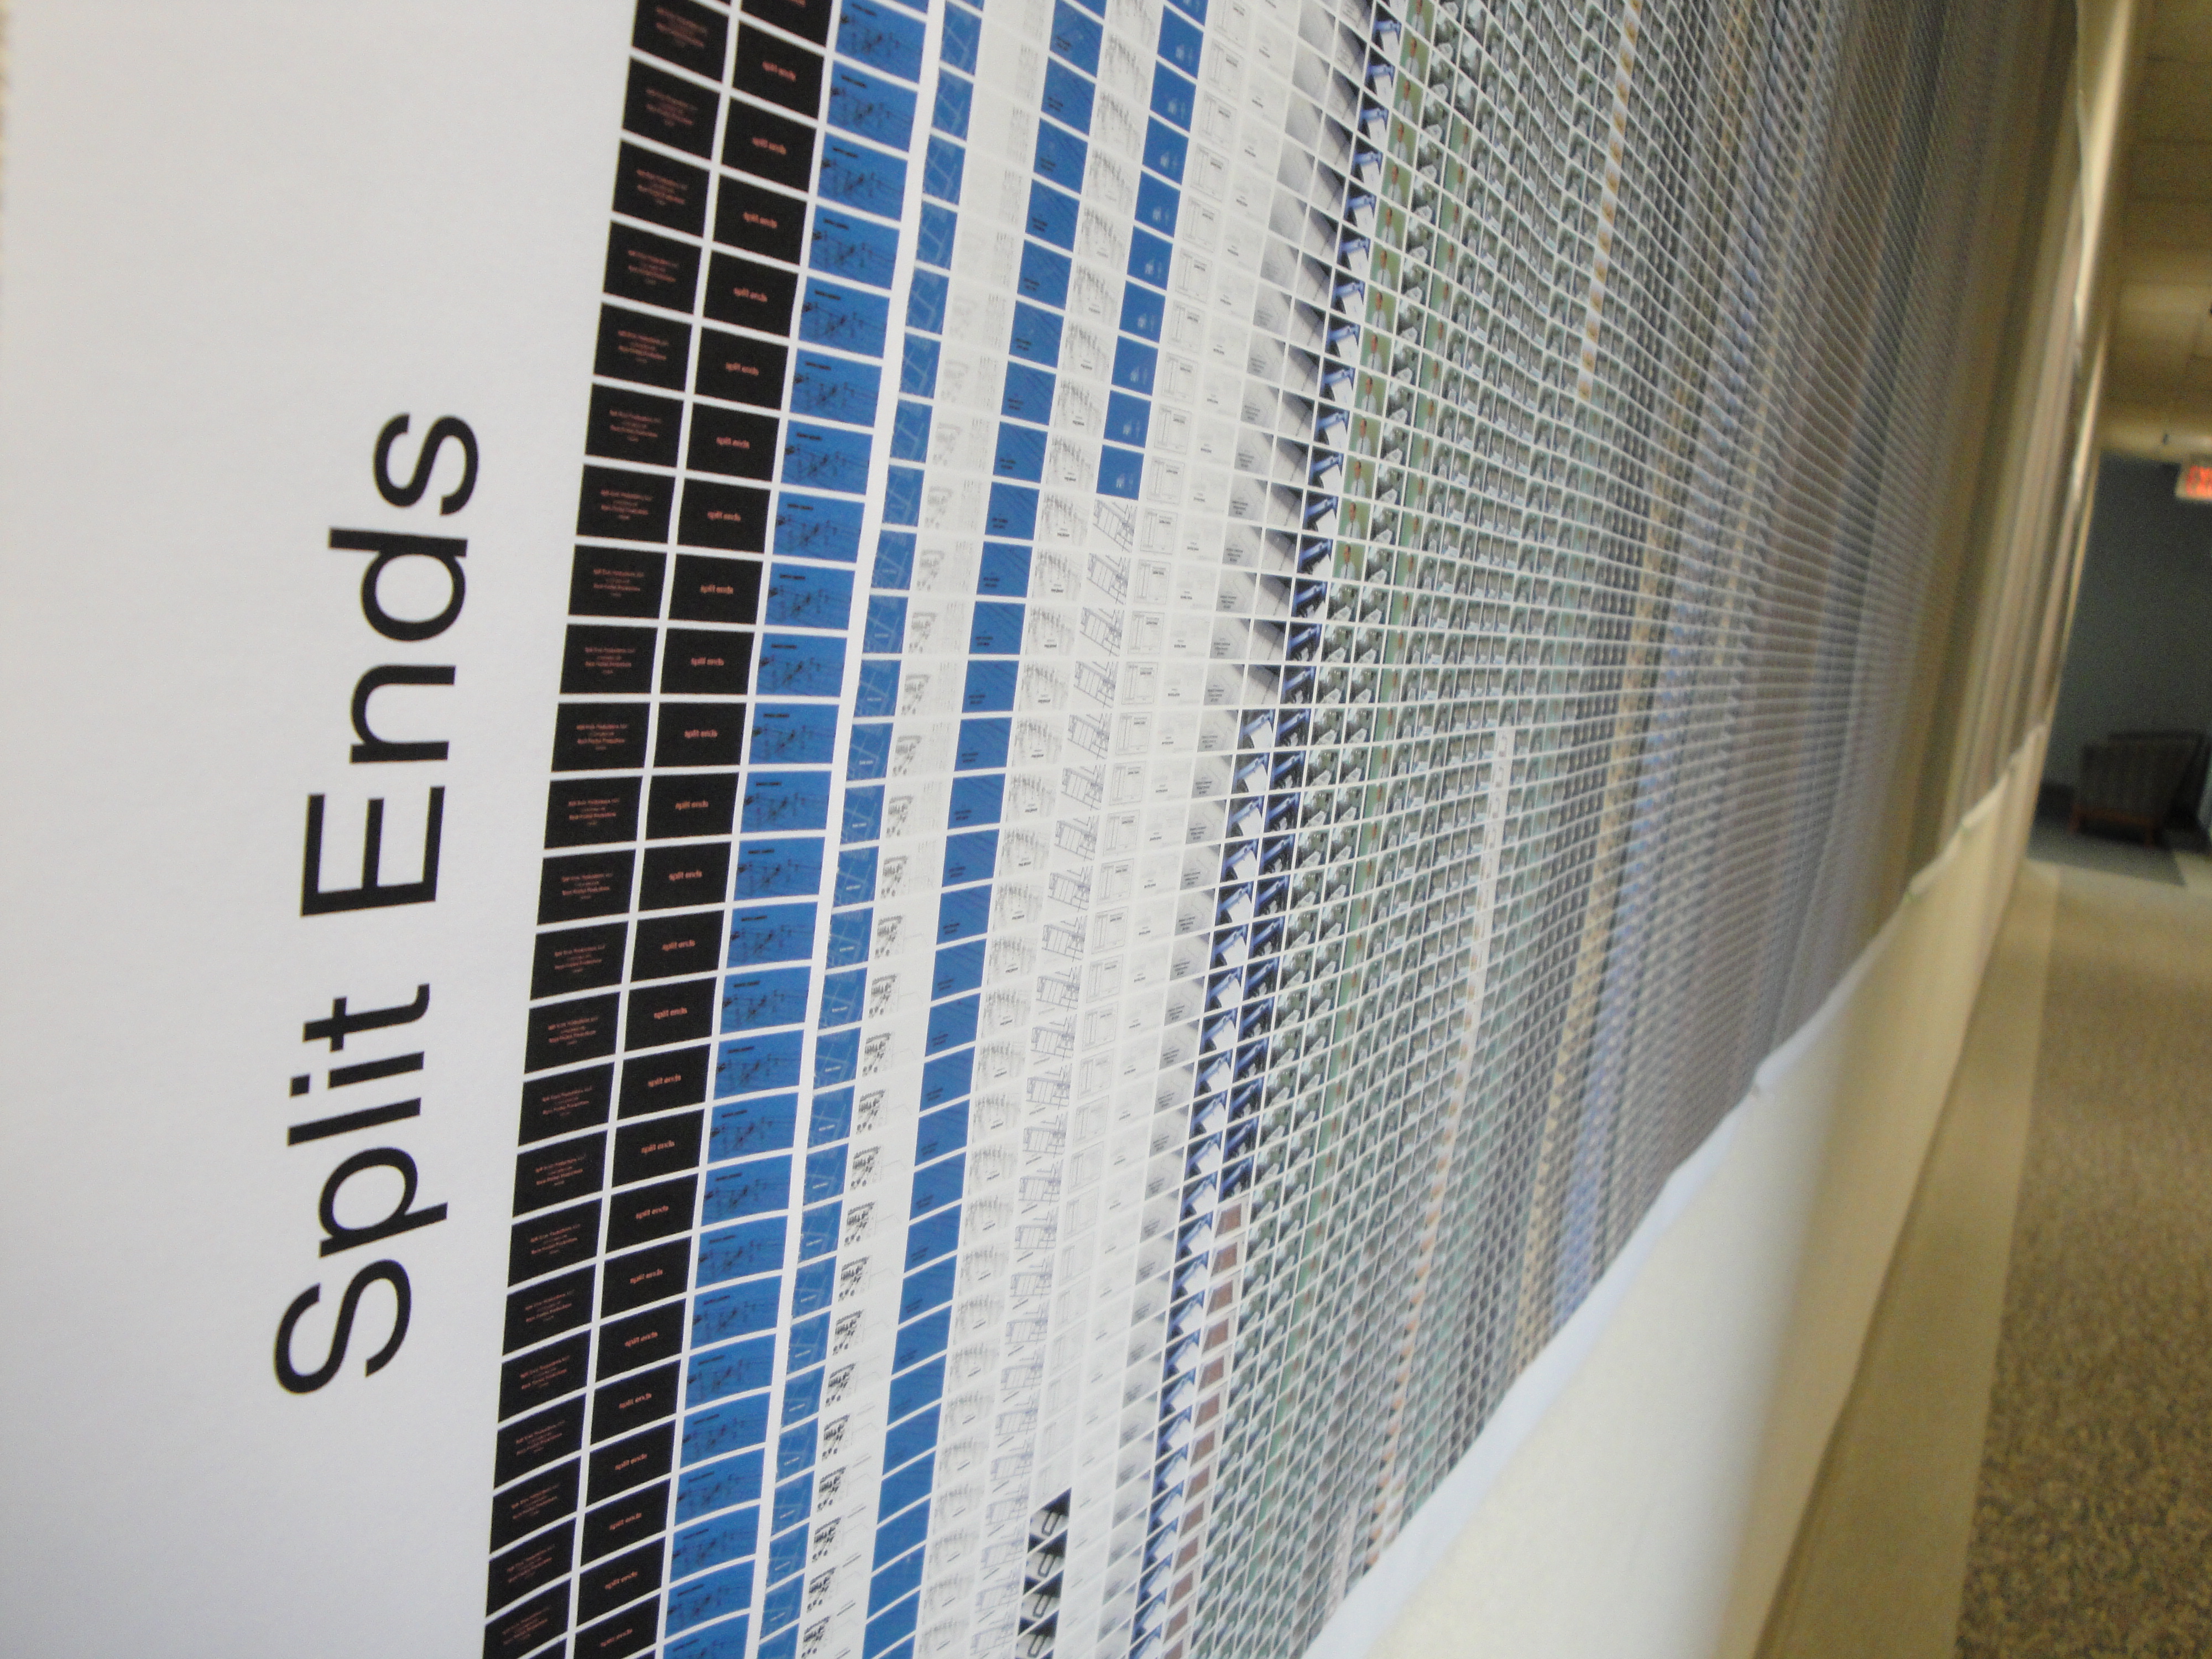
The plotter output shown above is from a 1.36 h animated movie comprising 720 frames per column by 163 columns. Cheswick's original motivation was to hammer the printer but, by considering each of the 117,360 micro-frames to be a color-encoded pixel, it might be possible to detect emergent global structure among the "bits" that is different from the typical story-board structure. However, caution is required because, although all meaning has a pattern, not all patterns have a meaning.

A strikingly similar kind of visualization has been applied to Darwin's Origin of Species, by color-encoding the updated text across all 6 editions. Here, a colored word of text corresponds to a movie frame in the previous example.
In mathematics, visualizing number-theoretic sequences as literal diadic bit-pattens can also reveal hidden global structure.

This is a plot of 2,000 iterations of a certain bit-sequence of the famous 3x+1 problem, that I generated in Mathematica. Each row contains 10 cells that are 16 bits wide by 50 bits deep. The iteration pattern (time series) is slightly different from the previous examples. It is read row-wise from top to bottom in each cell. This could easily be rearranged to be consistent with the above column-wise mappings. Do you see any plot in the plot?


"This motion picture is protected by the copyright laws of the United States of America and other countries. Any unauthorized duplication, copying or use of all or part of this motion picture may result in civil liability and/or criminal prosecution in accordance with applicable laws."
ReplyDeleteClosely related: Color Palettes of movie posters, sorted by MPAA rating: http://www.underconsideration.com/speakup/archives/003641.html
ReplyDeleteKeep the kids away from the reds and blacks...
As I understand it, Cheswick has only thrown his printer at a couple of FOSS-style movies.
ReplyDeleteWell, FOSS-style movies typically have more unusual plot lines than Hollywood-style movies so therefore the patterns they generate must be more complex!
ReplyDeleteMaybe, maybe not. It would be better to visualize the data.
ReplyDeleteAnyway, I don't think anything was mentioned about greater complexity being the criterion. On the contrary, it might turn out that certain simple patterns are better sellers at the box office/DVD. In which case, Cheswick might get Hollywood interested. A similar kind of thing has been claimed for creating broadly appealing pop music.
If multidimensional data could be encoded in to the color of the frame, i.e., soundtrack intensity, emotional content, rapidity of scene/camera changes, you could have an aggregate of the movie's "goodness" (whatever goodness is) for each frame. Printing this in a poster, or scrolling a bar of color in an iPhone app, could serve as an emotional movie review or as a guide for when to go to the snackbar or to cover one's eyes. "Uh oh, a red scene is coming up, cover juniors eyes" or "Hmm there is a lot of brown in this movie, I should go see Avatar again" or "I have to pee, here comes a gray section lasting 10 minutes, I'll go then"
ReplyDeleteBoy...clearly it's Friday...