Monday, June 10, 2013

The power of crowd sourcing

This morning on the local radio in the transmission Morning Edition there was a short piece on the new NSA data farm in Utah, which is supposed to go on-line this September. The piece stated that the data farm will store 5 zettabytes, and the old data farm in Virginia, which will remain on-line, has about 2/3 of the capacity.

These 8 zettabytes are contributed by us aliens, i.e. non citizens: this makes it crowd sourced data. How does this compare to the data that the best and brightest scientists in the world can create? At CERN, the CERN Data Centre has recorded over 100 petabytes of physics data over the last 20 years; collisions in the Large Hadron Collider (LHC) generated about 75 petabytes of this data in the past three years; the bulk of the data (about 88 petabytes) is archived on tape using the CERN Advanced Storage system (CASTOR) and the rest (13 petabytes) is stored on the EOS disk pool system — a system optimized for fast analysis access by many concurrent users. For the EOS system, the data are stored on over 17,000 disks attached to 800 disk servers; these disk-based systems are replicated automatically after hard-disk failures and a scalable namespace enables fast concurrent access to millions of individual files.

A zettabyte is 270 bytes and a petabyte is a paltry 250 bytes, indicating that crowd sourcing can yield 5 orders of magnitude more data than the best scientists can. And while the scientists use the most powerful particle smasher ever built by human kind, the crowd just uses their fingers on plain old keyboards.

The more mind-boggling data point is that at some point the NSA may want to synchronize the data in the two farms. To get an idea of the required bandwidth, consider that backing up a 1 terabyte (240 bytes) solid state disk to a top-of-the-line external disk over a FireWire 800 connection takes 5:39:39 hours…

CERN data centre

Servers at the CERN Data Centre collected 75 petabytes of LHC data in the last three years, bringing the total recorded physics data to over 100 petabytes (Image: CERN)

Friday, June 7, 2013

Why color naming

Mid June 1993 I was strolling along the Duna river in Szentendre with Antal Nemcsics and Lucia Ronchi. We stopped, looking across the river, while Nemcsics was explaining his Dynamic Color theory. Then he turned around and with a broad sweep of his arm he referred to the cityscape stating "it has just been all repainted in its original colors; is it not beautiful how all these yellows from the local clays harmonize?" He then started calling out the names for the yellows and explained how the restoration was based on the sequence of the color names.

When I interjected that color names are arbitrary conventions between painters, and sequences in a perceptually uniform color space might be better, he countered that the color names were not arbitrary but based on solid psychophysics. He answered my question on how the 15 students typically recruited for psychophysical experiments could define something so complex as the names of colors, with the bold statement that for many years all his students had to contribute their data and his Coloroid system was based on the outcome of over 80,000 experiments. Wow, big data!

I had to turn around to the Duna river and take a deep breath. That instant in Szentendre remained deeply impressed in my memory, and I visualized the color name regions of varying volume in the Coloroid space.

A decade later, when I was working on the readability problem of colored text on a colored background, I first implemented an algorithm based on distances in CIELAB. While the solution worked from an engineering point of view, it was not entirely satisfying, because a fixed distance in the entire CIELAB space did not reflect the reality of readability for the various color combinations.

Szentendre came to mind and I decided to try out a different implementation based on lexical distances. Implementing the Coloroid system was not a piece of cake, because the calculations are numerically instable and not all the details of the space are published. Also, if the color names in the Coloroid atlas are adequate for urbanistic applications, some extensions are required to achieve a bullet-proof application for automatic document publishing.

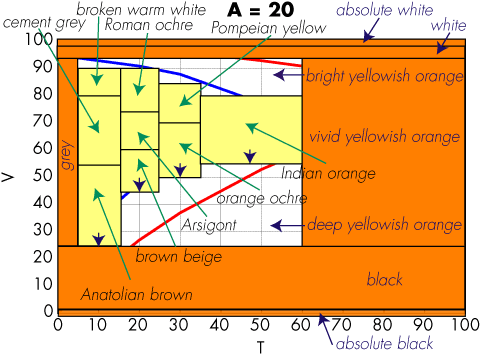
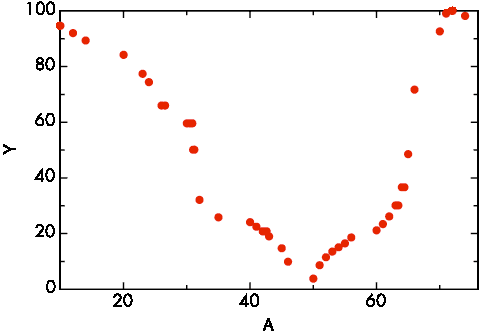
Boundary color Coloroid luminance

I presented the result at the 2005 AIC meeting in Granada, but I must admit that not many people stopped by at my poster, although it resulted in a collaboration with Silvia Zuffi on the CIELAB based implementation.

Coloroid hue A = 20

Since the color naming solution was going into a product, a patent application was filed, but very reluctantly and with much hesitation. Indeed, color naming and color categorization were very controversial.

Suddenly, in the last few days everything has changed. We now know experimentally that at the quantum level time does not really exists as we perceive it. This new twist on entanglement is one of the tenets for Federico Faggin's new proposal for the concept of awareness. In one arm of the entanglement we have Kirsty L. Spalding, who after a decade of very difficult work studying the hippocampus of people exposed to the fallout of nuclear bomb tests was able to prove experimentally the physiological existence of a locus for categorization. In the other arm we have patent 8,456,694, which thanks to this entanglement is made rock solid.

Thursday, June 6, 2013

Proofing a page for color discriminability problems based on color names

Now that there is a physiological basis for color categorization, we can ask ourselves what this is good for. We cannot eat it, but it might have considerable commercial value in United States Patent 8,456,694 issued two days ago on June 4, 2013. I am not a lawyer, but it appears that if you take two colors, determine their names, and then do anything with it, you might have to license this patent (but you can still keep your hippocampus ☺).

In large American corporations, when a new CEO start their new position, they often begin by putting their mark on the company's branding. They remodel their office and maybe even the HQ entrance, tweak the logo, design a new font, change the corporate palette, etc. These endeavors cost millions of dollars, but big corporations can afford it, especially when as a consequence other big corporations get motivated by the new branding to buy more widgets of the new CEO's company.

The only pity is that often this means that entire forests are wasted when the company has to reprint all its marketing collaterals. Around 2000, my employer at the time had a big warehouse in Campbell with product brochures, but fortunately our manager had been able to convince the company to deploy a document management system and print the marketing collaterals on demand, just when they were needed.

The hard problem came when a year later the CEO decided to change the color palette. Although all brochure chunks were stored digitally, when a brochure was produced by combining chunks with the old palette and chunks with the new palette, the resulting brochure looked inconsistent.

Colleagues Hui Chao and Xiaofan Lin quickly wrote code that could perform a wide range of graphical changes to the collaterals in the repository, and this writer wrote a few lines of code that would replace an old palette color with the perceptually nearest color in the new palette. Unfortunately, already the first test run demonstrated that this was a hack that did not work in practice. For example, many chicklets ended up having bright green text on orange background, something chromatically challenged people with color vision deficiencies could not read.

The solution that worked was to use a model to compute the names of the foreground and background colors, then change one of them to the nearest color in the new palette that was at least to color name categories away from the other color. This solution ended up being very good in practice and we wrote very efficient code that could process a large repository in a very short time.

I guess a sign of good engineering is to have the intuition for an unexpected solution before the scientists have worked out all the facts, …and we did not need nuclear bomb explosions.

Physiology of color categorization

Up to today there have been quite a few people writing off color naming and categorization as unserious hogwash. As of today, we know of a possible physiological basis, giving us a little more credibility.

In fact, now we know that neurogenesis it taking place in the hippocampus of adult humans. Fresh adult neurons have a specific function facilitating cognitive plasticity in the hippocampus—for example, in helping the brain distinguish between things that belong to the same category, or comparing new information to what it has already learned from experience. The ability to distinguish between vermilion and pink, yet still identify both as flamingo colors, is one example of this type of task in humans.

Kirsty L. Spalding et al. have found that a large subpopulation of hippocampal neurons constituting one-third of the neurons is subject to exchange. In adult humans, 700 new neurons are added in each hippocampus per day, corresponding to an annual turnover of 1.75% of the neurons within the renewing fraction, with a modest decline during aging. They conclude that neurons are generated throughout adulthood and that the rates are comparable in middle-aged humans and mice, suggesting that adult hippocampal neurogenesis may contribute to human brain function.

Reference: Dynamics of Hippocampal Neurogenesis in Adult Humans, Kirsty L. Spalding, Olaf Bergmann, Kanar Alkass, Samuel Bernard, Mehran Salehpour, Hagen B. Huttner, Emil Boström, Isabelle Westerlund, Céline Vial, Bruce A. Buchholz, Göran Possnert, Deborah C. Mash, Henrik Druid, Jonas Frisén: Dynamics of Hippocampal Neurogenesis in Adult Humans. Cell, Volume 153, Issue 6, 1219-1227, 6 June 2013.

Wednesday, May 22, 2013

Time is not instantaneous

Science Now today reports on a transitive photon entanglement experiment by Eli Megidish, Hagai Eisenberg, and colleagues at the Hebrew University of Jerusalem in which they show that two photons can be entangled even when they do not exist at the same time. Entanglement is explained by the conservation of energy, and their experiment suggests that this conservation does not have to be in an instant point.

They first create a pair of entangled photons 1 and 2, then they produce a second pair 3 and 4. Then they perform a "projective measurement" on photons 2 and 3, which entangles them. The entanglement property (polarization) of photon 1 is measured, which destroys it. When the entanglement 2, 3 is created after 1 has been measured, 1 and 4 have never coexisted at the same time as an entangled pair. By later measuring 4, the experiment shows that 1 and 4 are entangled.

In the middle, the article states correctly, that entanglement cannot be used to transmit information faster than the speed of light, but in the last paragraph this fact is contradicted. In reality, entanglement can be used to determine if a cipher has been read, but it cannot be used to transmit ciphers.

Link to the article: Physicists Create Quantum Link Between Photons That Don't Exist at the Same Time

Saturday, April 27, 2013

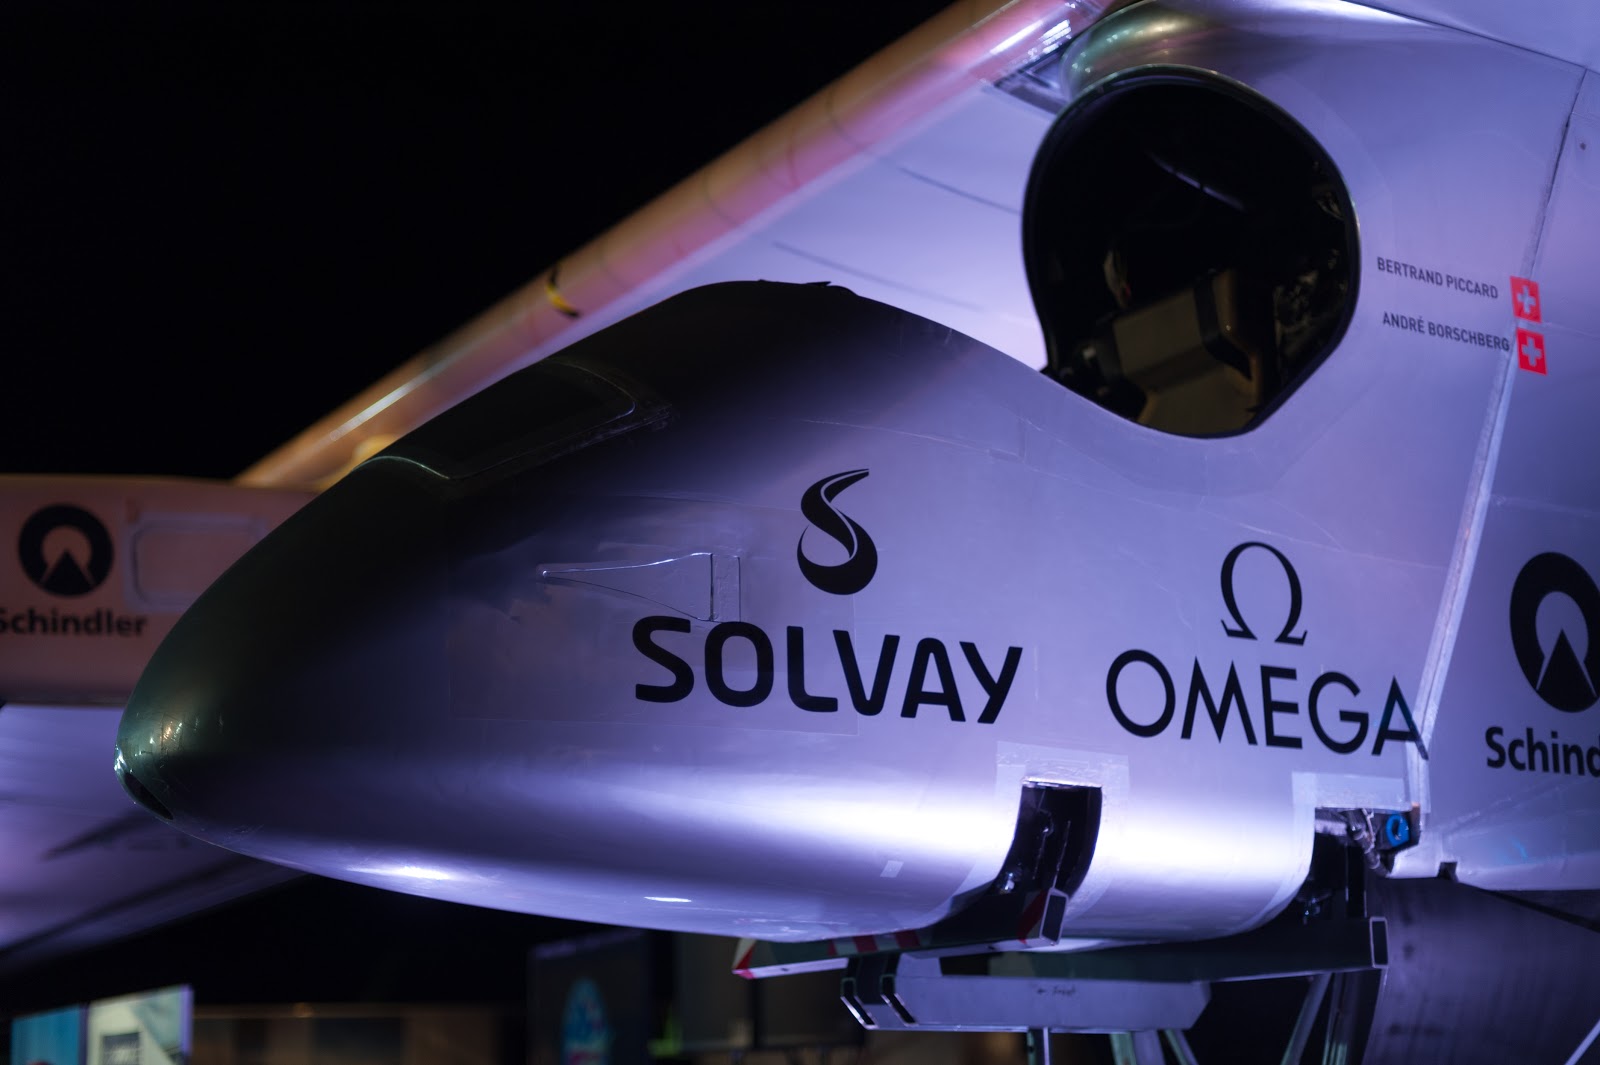
HB-SIA

HB-SIA

Two weeks ago, Switzerland started its new international tourism campaign, projecting a quaint image invented by Romantic writers like Friedrich Schiller and Johanna Spyri, with a few chaps from the Outback fighting in a Schwingen match. This suits well with the political majority party, who would like to place a cheese cloche over the country so it can live in a bubble.

Meanwhile, the Swiss fret over the 2050 energy package, ratified 25 May 2011, after Fukushima and the decision to exit nuclear energy generation. The slogan is that of the 2000-Watt Society, in which each person does not use more than 2000 W per day (today's average is 6000 W) and emits less than 1 Ton of CO2 per annum.

Such goals require the thought leadership of visionaries and effective demonstrators. Solar Impulse has been one of the best demonstrators. For example, in May 2012 it flew from Payerne across the Mediterranean to Rabat and Quarzazate, convincing the Moroccans that solar energy is the way of the future, supporting the plan by King Mohammed VI to construct the world’s largest thermo-solar power plant in Ouarzazate.

The visionaries behind Solar Impulse are Bertrand Piccard and André Borschberg, along with their sponsors and their big team.

Bertrand Piccard and André Borschberg

The numbers of Solar Impulse are quite impressive: with a wingspan of 63.40 m it is the size of an Airbus A340 or a 747, but it weighs only 1,600 Kg, just a little more than a Prius. Its range is infinite, because it can fly perpetually, since it produces much more electricity than it consumes, just as the Swiss hope to do with their houses.

Currently Solar Impulse is in Hangar 2 at Moffett Federal Airfield at Ames Research Center, getting ready for the next mission.

Admirers of Solar Impulse in Hangar 2

Solar Impulse in Hangar 2

Although the airplane can fly perpetually, in their 2015 flight around the world with the second model, license HB-SIB, Bertrand Piccard and André Borschberg will take turns every 5 days, because that is how long a trained human can stay awake and pilot, and also sit with very limited motion on the pilot seat/toilet combo:

Solar Impulse cockpit

On the first of May, Bertrand Piccard and André Borschberg will take off from Moffett Field at a speed of 44 km/h and fly their Across America mission, which will take them to Phoenix, Dallas, Saint Louis or Atlanta, Washington D.C., and finally JFK in New York City.

If you happen to look up and see a jumbo with license HB-SIA soaring silently at a speed of 70 km/h, think what you can do to give back more energy than you consume, so your total usage (think at those servers farms delivering your contents) is below 2000 W per day. In the case of the Solar Impulse, its 11,628 SunPower solar cells have an efficiency of 23% and drive the four brushless sensorless electric engines in addition of charging the batteries for when there is no sunlight.

Tuesday, April 16, 2013

Monday, April 15, 2013

Alpine Internet Speeds

The Swiss Federal Office of Communications has published a map of telecommunications in Switzerland. The map can show television availability, upload and download speeds, connection types, and the number of providers, all at a resolution of 250 meters. The publication also provides a guide to broadband expansion projects taking place in Switzerland. The goal of the publication is to help plan broadband access projects and to help users make smart decisions regarding telecommunications.


Link to the tool: broadband map (in German, French and Italian)

Scaling body size fluctuation

Flocks of birds, schools of fish, and groups of any other living organisms might have a mathematical function in common. Studying aquatic microorganisms, Andrea Giometto, a researcher EPFL and Eawag, showed that for each species he studied, body sizes were distributed according to the same mathematical expression, where the only unknown is the average size of the species in an ecosystem.

Taken together, these observations of size distributions within a species and within all the species in a given ecological community have interesting implications. If in an ecosystem several species begin to converge around the same size, a balancing force will kick in to restore the power-law distribution, either by acting on the abundance or size of each species.

Finding power-laws and using them to describe complex systems already has a successful track record. “In physics, the observation that systems followed power-laws was instrumental in understanding phase transitions. We believe that power-laws can be similarly helpful to gain a deeper understanding of how systems of living matter work,” says Giometto, a physicist, who is seeking to apply methods from his field to understand biological ecosystems.

Link to the paper: Scaling body size fluctuations

Sunday, April 7, 2013

Where is the sun?

When we take architectural pictures, we want to have the sun shining from the side, because this accentuates the edges. In the old days, this meant a shoot took two days, one to visit the sites of the buildings of interest to determine the best time, and a second day to do the actual shoots in a tour taking us to each building at the best time.

Today this is much easier. We can use an online tool like SunCalc to determine the best time.

In the box at the top left you enter the shoot location, then on the horizontal time scale you simply drag the orange dot. On the map, the thick orange segment indicates the sunlight direction. Just move the orange dot on the slider until the segment hits the façade more or less perpendicularly. You can enter the data into a spreadsheet, which you sort by the time, to get your itinerary.

By they way, the thin orange curve is the current sun trajectory, and the yellow area around is the variation of sun trajectories during the year. The closer a point is to the center, the higher is the sun above the horizon. The colors on the time slider above show sunlight coverage during the day.