Almost every time I step out and encounter a former colleague in my age group, I hear the story of the wasted brains of Silicon Valley. Although, the official
unemployment rate (seasonally adjusted) for California is 12.6%, the news media has variously estimated the number of older unemployed or underemployed R&D people here to be rather slightly above 50%.
These are numbers that the Internal Revenue Service and the State of California Franchise Tax Board have, but the data must be compiled from their published data by postal code and separately for every year. This is a laborious job, so we have to trust the declarations of politicians complaining of sharply lower tax revenue for the year just finished.
In fact, the tax authorities can look at salary evolution over the years, aggregating by profession. Ideally, for society, education is an investment. A person starts with a given salary, which increases monotonically as the person acquires more experience and is more useful to society in terms of increased contribution to the gross domestic product (GDP). The cost to society consists of financing the schools, one of the main budget items.
Education is an investment because the more educated individual starts with a higher salary and has a chance of sharper increases at promotions, e.g., to principal scientist, fellow, and VP. Unfortunately, things did not pan out as planned, for the County of Santa Clara.
For example, taking a social security number at random out of Santa Clara's pool of scientists, instead of a nice monotonic curve with a few positive jumps, one obtains more a curve like this when one plots the data in line 7 of form 1040 (in April 2010 dollars):
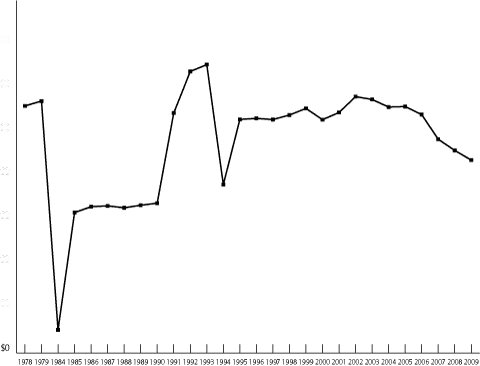
Clearly, financing the scientist's education as been a rather poor investment for the state. It has been suggested by Stanford's Prof. Martin Morf, that researchers should be forced to hire an agent, like this is done by celebrities, or at least a compensation lawyer, like this is done by executives.
The usual ranting is that R&D has moved farther west, to Asia. One solution would be to move researchers where research is performed, but this is a touchy subject (brain drain). A different approach is to adjust the researcher's skills and occupation according to industry's needs, i.e., making the system more flexible.
When twenty years ago I was part of a team starting up a new business and had no experience in doing so, with one of my colleagues we researched the business literature. We quickly found out, that business books are of little use, because they consist of case studies, which are useful to explain the past but not to plan the future.
The one book that has been useful to us was Gordon Bell's book High-Tech Ventures.
The main take-away was the dynamics of a relational graph showing the status of an ideal start-up at the end of each of its four stages of growth. The evolution was divided in four stages: concept (bluish), seed (greenish), product development (yellowish), and market development (reddish). The twelve dimensions covering marketing/sales, people, finance/control, and technology/product were then weighted relative to the needs in the last stage:

The message is that what counts is not the total amount invested in R&D, but how the resources are allocated proportionally during the various stages of building an operation. Once the business unit is in market development, R&D not longer needs to emphasized versus the other dimensions.
This becomes clear when one compares the R&D expenditure of various companies: it is not correlated to their long-term success. Let us first define this last term.
The usual objective function used to optimize a business is its stock price. However, it is not good practice to use a betting average as a metric. Similarly, CEO pay is not a good metric, because usually corporations invest 10% of their revenue in compensation, paying competitive salaries to their regular workers and splitting up the rest among the executives, hence there is no performance component.
The main job of a company is to create and develop a workforce that generates a high revenue. In this view, a good metric to use as a cost function to compare companies is the revenue per employee. Let us interrogate Wolfram|Alpha for some high-tech companies:
| Ticker | Market | Employees | Revenue | Net Income |
R&D Expense |
|---|---|---|---|---|---|
| A | NYSE | 16,800 |
4.480 G$ |
-0.031 G$ |
0.642 G$ |
| AAPL | NASDAQ | 36,800 |
42.050 G$ |
7.477 G$ |
1.416 G$ |
| ACN | NYSE | 177,000 |
22.450 G$ |
1.555 G$ |
0.000 G$ |
| ADBE | NASDAQ | 8,660 |
2.946 G$ |
0.387 G$ |
0.565 G$ |
| AMD | NYSE | 10,400 |
5.402 G$ |
0.370 G$ |
1.721 G$ |
| AMZN | NASDAQ | 24,300 |
24.510 G$ |
0.902 G$ |
0.146 G$ |
| CDNS | NASDAQ | 4,900 |
0.860 G$ |
-1.791 G$ |
0.373 G$ |
| CSCO | NASDAQ | 65,500 |
35.530 G$ |
6.069 G$ |
4.994 G$ |
| DELL | NASDAQ | 78,900 |
51.430 G$ |
1.450 G$ |
0.621 G$ |
| EK | NYSE | 24,400 |
7.606 G$ |
-0.210 G$ |
0.361 G$ |
| EMC | NYSE | 42,100 |
13.940 G$ |
1.002 G$ |
1.644 G$ |
| GOOG | NASDAQ | 19,835 |
23.650 G$ |
6.520 G$ |
2.843 G$ |
| HPQ | NYSE | 304,000 |
114.600 G$ |
7.660 G$ |
2.819 G$ |
| IBM | NYSE | 399,409 |
95.760 G$ |
13.430 G$ |
5.820 G$ |
| INTC | NASDAQ | 83,900 |
35.130 G$ |
4.369 G$ |
5.653 G$ |
| IXYS | NASDAQ | 943 |
0.225 G$ |
-0.016 G$ |
0.019 G$ |
| MFE | NYSE | 5,600 |
1.826 G$ |
0.164 G$ |
0.307 G$ |
| MOT | NYSE | 53,000 |
22.040 G$ |
-0.048 G$ |
3.183 G$ |
| MSFT | NASDAQ | 93,000 |
58.690 G$ |
16.260 G$ |
8.581 G$ |
| NCR | NYSE | 22,400 |
4.688 G$ |
0.080 G$ |
0.142 G$ |
| NVDA | NASDAQ | 5,420 |
2.825 G$ |
-0.347 G$ |
0.904 G$ |
| ORCL | NASDAQ | 86,000 |
23.230 G$ |
5.802 G$ |
2.775 G$ |
| STX | NASDAQ | 54,000 |
10.019 G$ |
0.358 G$ |
0.893 G$ |
| SYMC | NASDAQ | 17,400 |
5.922 G$ |
0.316 G$ |
0.876 G$ |
| SYNA | NASDAQ | 524 |
0.469 G$ |
0.041 G$ |
0.079 G$ |
| TXN | NYSE | 26,584 |
10.430 G$ |
1.470 G$ |
1.477 G$ |
| UIS | NYSE | 25,600 |
4.598 G$ |
0.194 G$ |
0.102 G$ |
| XRX | NYSE | 57,100 |
15.330 G$ |
0.320 G$ |
0.827 G$ |
| YHOO | NASDAQ | 13,600 |
6.535 G$ |
0.143 G$ |
1.181 G$ |
We then calculate the cost function and sort by its values to verify that R&D expense is not correlated to the revenue per employee. Since computation is cheap, we can also compare to the percentage of the profits reinvested in R&D, the total revenue, and the profit margin.
| Company | Revenue to R&D |
Profit to R&D |
Margin | Revenue | Revenue per Employee |
|---|---|---|---|---|---|
12.0% |
43.6% |
27.6% |
23.650 G$ |
1,192,000 $ |
|
| Apple | 3.4% |
18.9% |
17.8% |
42.050 G$ |
1,143,000 $ |
| Amazon | 0.6% |
16.2% |
3.7% |
24.510 G$ |
1,009,000 $ |
| Synaptics | 16.8% |
191.0% |
8.8% |
0.469 G$ |
895,000 $ |
| Dell | 1.2% |
42.8% |
2.8% |
51.430 G$ |
652,000 $ |
| Microsoft | 14.6% |
52.8% |
27.7% |
58.690 G$ |
631,000 $ |
| Cisco | 14.1% |
82.3% |
17.1% |
35.530 G$ |
542,000 $ |
| nVIDIA | 32.0% |
loss |
-12.3% |
2.825 G$ |
521,000 $ |
| AMD | 31.9% |
465.1% |
6.8% |
5.402 G$ |
519,000 $ |
| Yahoo! | 18.1% |
827.8% |
2.2% |
6.535 G$ |
481,000 $ |
| Intel | 16.1% |
129.4% |
12.4% |
35.130 G$ |
419,000 $ |
| Motorola | 14.4% |
loss |
-0.2% |
22.040 G$ |
416,000 $ |
| Texas Instruments | 14.2% |
100.5% |
14.1% |
10.430 G$ |
392,000 $ |
| HP | 2.5% |
36.8% |
6.7% |
114.600 G$ |
377,000 $ |
| Adobe | 19.2% |
146.2% |
13.1% |
2.946 G$ |
340,000 $ |
| Symantec | 14.8% |
277.0% |
5.3% |
5.922 G$ |
340,000 $ |
| EMC | 11.8% |
164.1% |
7.2% |
13.940 G$ |
331,000 $ |
| McAfee | 16.8% |
187.0% |
9.0% |
1.826 G$ |
326,000 $ |
| Kodak | 4.7% |
loss |
-2.8% |
7.606 G$ |
312,000 $ |
| Oracle | 11.9% |
47.8% |
25.0% |
23.230 G$ |
270,000 $ |
| Xerox | 5.4% |
258.4% |
2.1% |
15.330 G$ |
268,000 $ |
| Agilent | 14.3% |
loss |
-0.7% |
4.480 G$ |
267,000 $ |
| IBM | 6.1% |
43.3% |
14.0% |
95.760 G$ |
240,000 $ |
| IXYS | 8.3% |
loss |
-6.9% |
0.225 G$ |
238,000 $ |
| NCR | 3.0% |
177.5% |
1.7% |
4.688 G$ |
209,000 $ |
| Seagate | 8.9% |
249.4% |
3.6% |
10.019 G$ |
186,000 $ |
| Unisys | 2.2% |
52.5% |
4.2% |
4.598 G$ |
180,000 $ |
| Cadence | 43.4% |
loss |
-208.3% |
0.860 G$ |
175,000 $ |
| Accenture | 6.9% |
22.450 G$ |
127,000 $ |
Clearly, the revenue per employee does not depend on the percentage of revenue invested in R&D, nor to other simple metrics, as can be seen even more clearly in this graphical representation:

If you still believe R&D is a key factor to success, consider this historical data in Table 5.2 of Bell's book, where the data is for 1989, but in April 2010 dollars, so you can compare with today's data in the table above.
Company |
1989 R&D |
|---|---|
America |
|
| IBM | 10.3 G$ |
| Digital (DEC) | 2.3 G$ |
| Hewlett-Packard (HP) | 1.7 G$ |
| Xerox | 1.4 G$ |
| Unisys | 1.2 G$ |
| Motorola | 1.2 G$ |
| Hughes | 1.0 G$ |
| Texas Instruments (TI) | 0.9 G$ |
| NCR | 0.7 G$ |
| Control Data Corporation (CDC) | 0.5 G$ |
| Honeywell | 0.5 G$ |
| Intel | 0.5 G$ |
| National | 0.5 G$ |
| Apple | 0.5 G$ |
| Wang | 0.3 G$ |
Japan |
|
| NEC | 6.5 G$ |
| Hitachi | 4.9 G$ |
| Matsushita (Panasonic) | 4.2 G$ |
| Fujitsu | 3.3 G$ |
| Toshiba | 3.0 G$ |
| Sony | 1.9 G$ |
| Sharp | 0.9 G$ |
| Canon | 0.9 G$ |
| Ricoh | 0.7 G$ |
| Omron | 0.3 G$ |
Comparing the 1989 with the 2010 data gives some moment to pause…
After this pause, the question remains how society can protect its investment in education. One answer is that universities should not direct its graduates towards large research labs. Instead, it should give them the tools to become entrepreneurs.
This is what Switzerland has done. After students obtain their master, they either continue towards a career into academia or they do an engineering MBA so they have the business know-how to start a new company based on the technology created for their doctoral work. Switzerland has also beefed up the colleges so they can educate a highly skilled workforce to feed these new companies.
To further encourage the Swiss educated population to stay on the bleeding edge of high-tech, patents are encouraged only for products that are easy to copy by competitors. The preferred strategy is to run faster than the competition: the 100K it costs to get a world-wide patent is better spent on an additional researcher who develops a new technology before the competition has caught up with the previous technology.
For the large companies everywhere, the lesson is that they have to keep grooming and training their scientists so they can keep moving into the latest fields being invented. They also need a flexible and flat hierarchy that allows people to easily move around. The previous table shows that a sclerotic company is never too big to fail or at least to stumble.
Since the original investment is made by the state, its universities should be able to offer continuous education. In the past, universities had intensive summer courses and learned societies had short courses at their meetings, but these opportunities atrophied with research labs disappearing and companies no longer training their researchers.
At larger intervals, scientists should once again be sent on sabbaticals so they can rethread themselves. If you looked at the LabPQR slides, you will have noted that while the research on a spectral ICC workflow was taking place at RIT, Onyx Graphics sent Mr. Maxim Derhak and Canon sent Mr. Shohei Tsutsumi to take part in the research and become masters in the new art.
A small high-tech company has to be agile, it must be able to run faster than its competitors to remain successful. Therefore, it must be sure that its workforce is always up-to-date with their knowledge and technology suppliers give it a preferential status.
In large companies, the situation is a little different, because they cannot be agile, but can make up for it by being a dominant market force. Also, their research lab must offer better value than buying a small company with the required technology. The Japanese are masters at the cycle of knowledge. When a technology becomes hot, a well-trained army of scientists must be ready to make a big effort at the new technology. As the technology moves to engineering, slowly scientists must be taken off the project as engineers take over their place.
The best time to finish a project is when standards are being negotiated. This means that the technology is no longer so hot that only few understand it, but knowledge is sufficiently diffuse that anybody who wants can adopt it and it becomes necessary to set standards for interoperability.
Finishing a project does not mean to kill it. As long as a technology is not yet obsolete, a small number of people needs to keep tracking and pushing the technology. However, the bulk of the team should pursue the next hot technology, and sabbaticals are one good mechanism to do that.
For example, research on color management systems was essentially finished when the ICC consortium was created. Last year, Dr. Ingeborg Tastl organized a panel discussion on what is next in research on color science. The panelists discussed open problems, like complex color and top-down models, but these topics require only a small number of researchers, compared to the large teams figuring out how to predict color on a printer and map color across devices.

The question remains, how can we resurrect the wasted brains of Silicon Valley? In Switzerland the government has encouraged industry to get experienced employees out of retirement so they have the brain-power to get out of the recession. It has worked, but the cost is the high (by Swiss standards) unemployment in the young people fresh out of school.
Society needs to look at its investment portfolio and re-balance it to improve the return on investment. The engine of innovation needs lubrication!


No comments:
Post a Comment