Around 1987, I was working in a bustling and teeming research lab. I was traveling relatively little, because every researcher traveling in the area was without fail coming to visit, so I could be an active member of the color science community without having to attend each and every conference.
Since the lab was banking on synergy and serendipity, my work was very focused, which was reflected in my desk:

There was no clutter because I was working on just one research item. Of course Saturdays were an exception, because after the routine shopping at the farmers market and the almond croissant with coffee at the long defunct Italian bakery at the corner of Waverley and University, I would head to the office and play with ideas from papers read during the week or ideas from conversations in the SF Bay Area color scientists meetings Friday afternoon at the Tied House micro-brewery. Then I would incorporate the best gems into my code library. The desk would get very messy by day's end, but I would clean it up first thing Monday morning.
When in 1990 I changed employer and moved across the street, my role changed. It was my turn to create a bustling organization, teeming with people carefully groomed to magically make synergies and serendipity happen naturally.
Because my work was no longer focused but had to span the large set of interests dear to my new employer, I started building little piles on my desk. Each pile was the accumulation of hot papers on a topic I thought could be of interest for research by somebody in my sphere of influence. I was attending numerous conferences, so the piles grew quickly, until the economic bubble in Japan burst and I was out of a job.
My wife convinced me to stick to my activity of providing direction and to influence research groups, in the hope it would help me find a real job. I also started again reviewing manuscripts, typically over a manuscript per week. This allowed me to be intimately familiar with the research of all color imaging scientists in the world. It also allowed me to easily see the research vectors and who is hitting on all pistons vs. those straying off the path or getting stuck in the sand. More importantly, I could discern the interpolators from the extrapolators, the followers from the leaders.
Typically around April I would consult my piles and attempt a prediction of the future research in color imaging. The result would then be a series of sessions to be held at one or more conferences. With my wife's help I would send out personalized letters to the various scientists explaining the content of a session and how I would like them to contribute a paper on their piece of the work to the conference so it nicely fits in the session. Of course, each session would start with an invited paper from one of the leaders.
On the positive side, this helped my becoming a deus ex machina, invisibly making things happen and steering research without being detected. On the negative side, despite my efforts to operate like a cloaked ninja, my supervisors still felt I had too much visibility for a puny software engineer. It were more principled and distinguished scientists whom such roles would suit.
As corporations and their many organizations meander, activities are terminated, resumed, terminated, etc. in an endless come and go, like a relentless tide in the western style ocean 洋. Hence, a few years after disarticulating myself from all academic activities, I slowly but stealthy slipped into it again, this time into the services of various governmental organizations, influencing very long term research vectors in the benefit of society.
During all this, I kept providing tender love and care to my piles. But then, as the organizational division between the illuminated and the ignorant became more of a chasm that cannot be crossed, I again had to dissociate from my academic activities to focus on optimizing ANSI C code. This time, my piles also had to go!
One by one I gave them my farewell and transferred them into the blue recycling bin kindly provided in my cubicle.
Today is the day to say farewell to one of my more cherished piles: complex color. Most of what color engineers do deals with aperture color, perceived color for which there is no definite spatial localization in depth, such as that perceived as filling a hole in a screen. However, in color imaging we deal mostly with complex color.
To me the difference became exceedingly apparent in a personal experience. I was attending one of the ISCC annual meetings in the early Nineties. One of Smith and Pokorny's student had given an excellent paper presenting some new results in chromatic induction he had obtained in pursuit of his Ph.D. thesis. In the evening of the same day, the conference reception took place in a ballroom that had been recently refurbished. The carpet was in a deep cobalt azure background carrying a tan arabesque design; it looked grand and the decor with the elaborate chandeliers had a certain majestic feel. The tapestry on the walls matched the carpet.
That is, until you were closer to the wall. There you could resolve the pattern in the tapestry, which was a more muted azure with a bright orange filigree. From distance, the carpet and the tapestry matched, but from close they clashed. With what I learned in the student's presentation, this was the start of a precious pile on complex color.
A little later came Stanford's Brian Wandell's research on spacial CIELAB and his student Xuemei Zhang's Ph.D. on S-CIELAB: A Spatial Extension to the CIE L*a*b* DeltaE Color Difference Metric.
At the beginning of the new Millennium, in May 2002 Prof. Lucia Ronchi sent me a large envelope with pieces of colored fabric and a black and white piece of paper. It contained a letter instructing me to mount the fabric pieces on a high-speed fan and observe them. When the fan is accelerated to the highest speed, the letter explained, you will get a succession of colored concentric discs. She found an explanation for the black and white patterns, but not for the colored patterns. It also went onto the complex color pile.

But my most precious paper in the complex color pile is a manuscript for IEEE TIP Todd Ell and Stephen Sangwine wrote early 2005. It came out January First, 2007 under the title Hypercomplex Fourier Transforms of Color Images. I had a brief email exchange with the second author. Their method had a radically new approach, which took them 10 years to research, produce, and create.
Subsequently, several derivative manuscripts — mostly from Asia — crossed my desk, but they did not make it onto my pile, because the authors mostly had downloaded the Matlab code and just played with it, without fully understanding the underlaying theory and not adding a substantial contribution of their own.
Since I stopped a while back tending to my piles, I do not know how the work progressed, but as of 2007 it had a lot of potential. Essentially, the three color coordinates are viewed as the complex parts of a quaternion. The breakthrough was to find a Fourier transform in the quaternion field. They made it practical using the Cayley-Dickson form to represent quaternions, then they invented the symplectic decomposition.
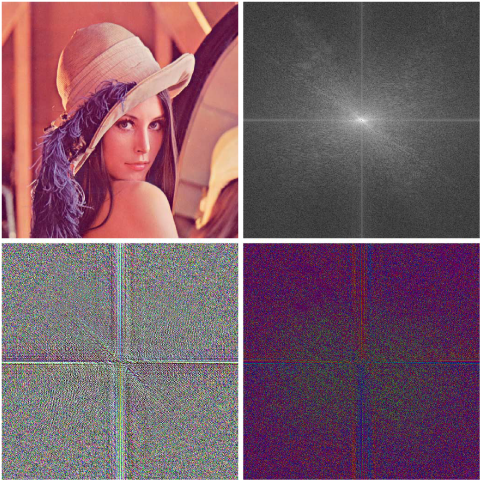
In the case of quaternions, the hypercomplex spectrum yields a modulus, a phase, and an axis image. I do not know how this is interpreted in color imaging, but I have the sensation it is something powerful. Finding out probably takes two years of playing with their Matlab library to fully understand the underlying mathematics and build an intuition. Then another couple of years to come up with a new insight. With another couple of years to find a solution to a difficult problem and develop an application, this is beyond a Ph.D. thesis assignment. It is also beyond what can be done in a skunkworks project.
In fact I am not even able to understand the meaning of the inverse hypercomplex Fourier transform. The complication is that quaternions are not Abelian in their second operation. One ends up not with a forward an a backward Fourier transform, but a whole graph of relationships between the operators.

Ell and Sangwine explain: The above is an operator graph showing a summary of the known relationships between the seven operators. The directed lines indicate forward transforms. Navigating the same line in the opposite direction denotes the corresponding inverse transform. Conjugate and reversal are shown with undirected lines since they are their own inverses. Navigating the graph along an closed path yields the identity operator. Solid points indicate spatial domains and hollow points indicate frequency domains.
さよなら, farewell complex color pile. I hope the recycler will reincarnate you as an important book.


Together with the noncommutativity, I worry about that pesky fourth component of the quaternion, which simply cannot be excluded when you multiply two general three-component quaternions. I too am mystified by complex color.
ReplyDelete